“I’m all in!”
According to this week’s featured indicator, that’s what investors have been saying about the stock market recently.
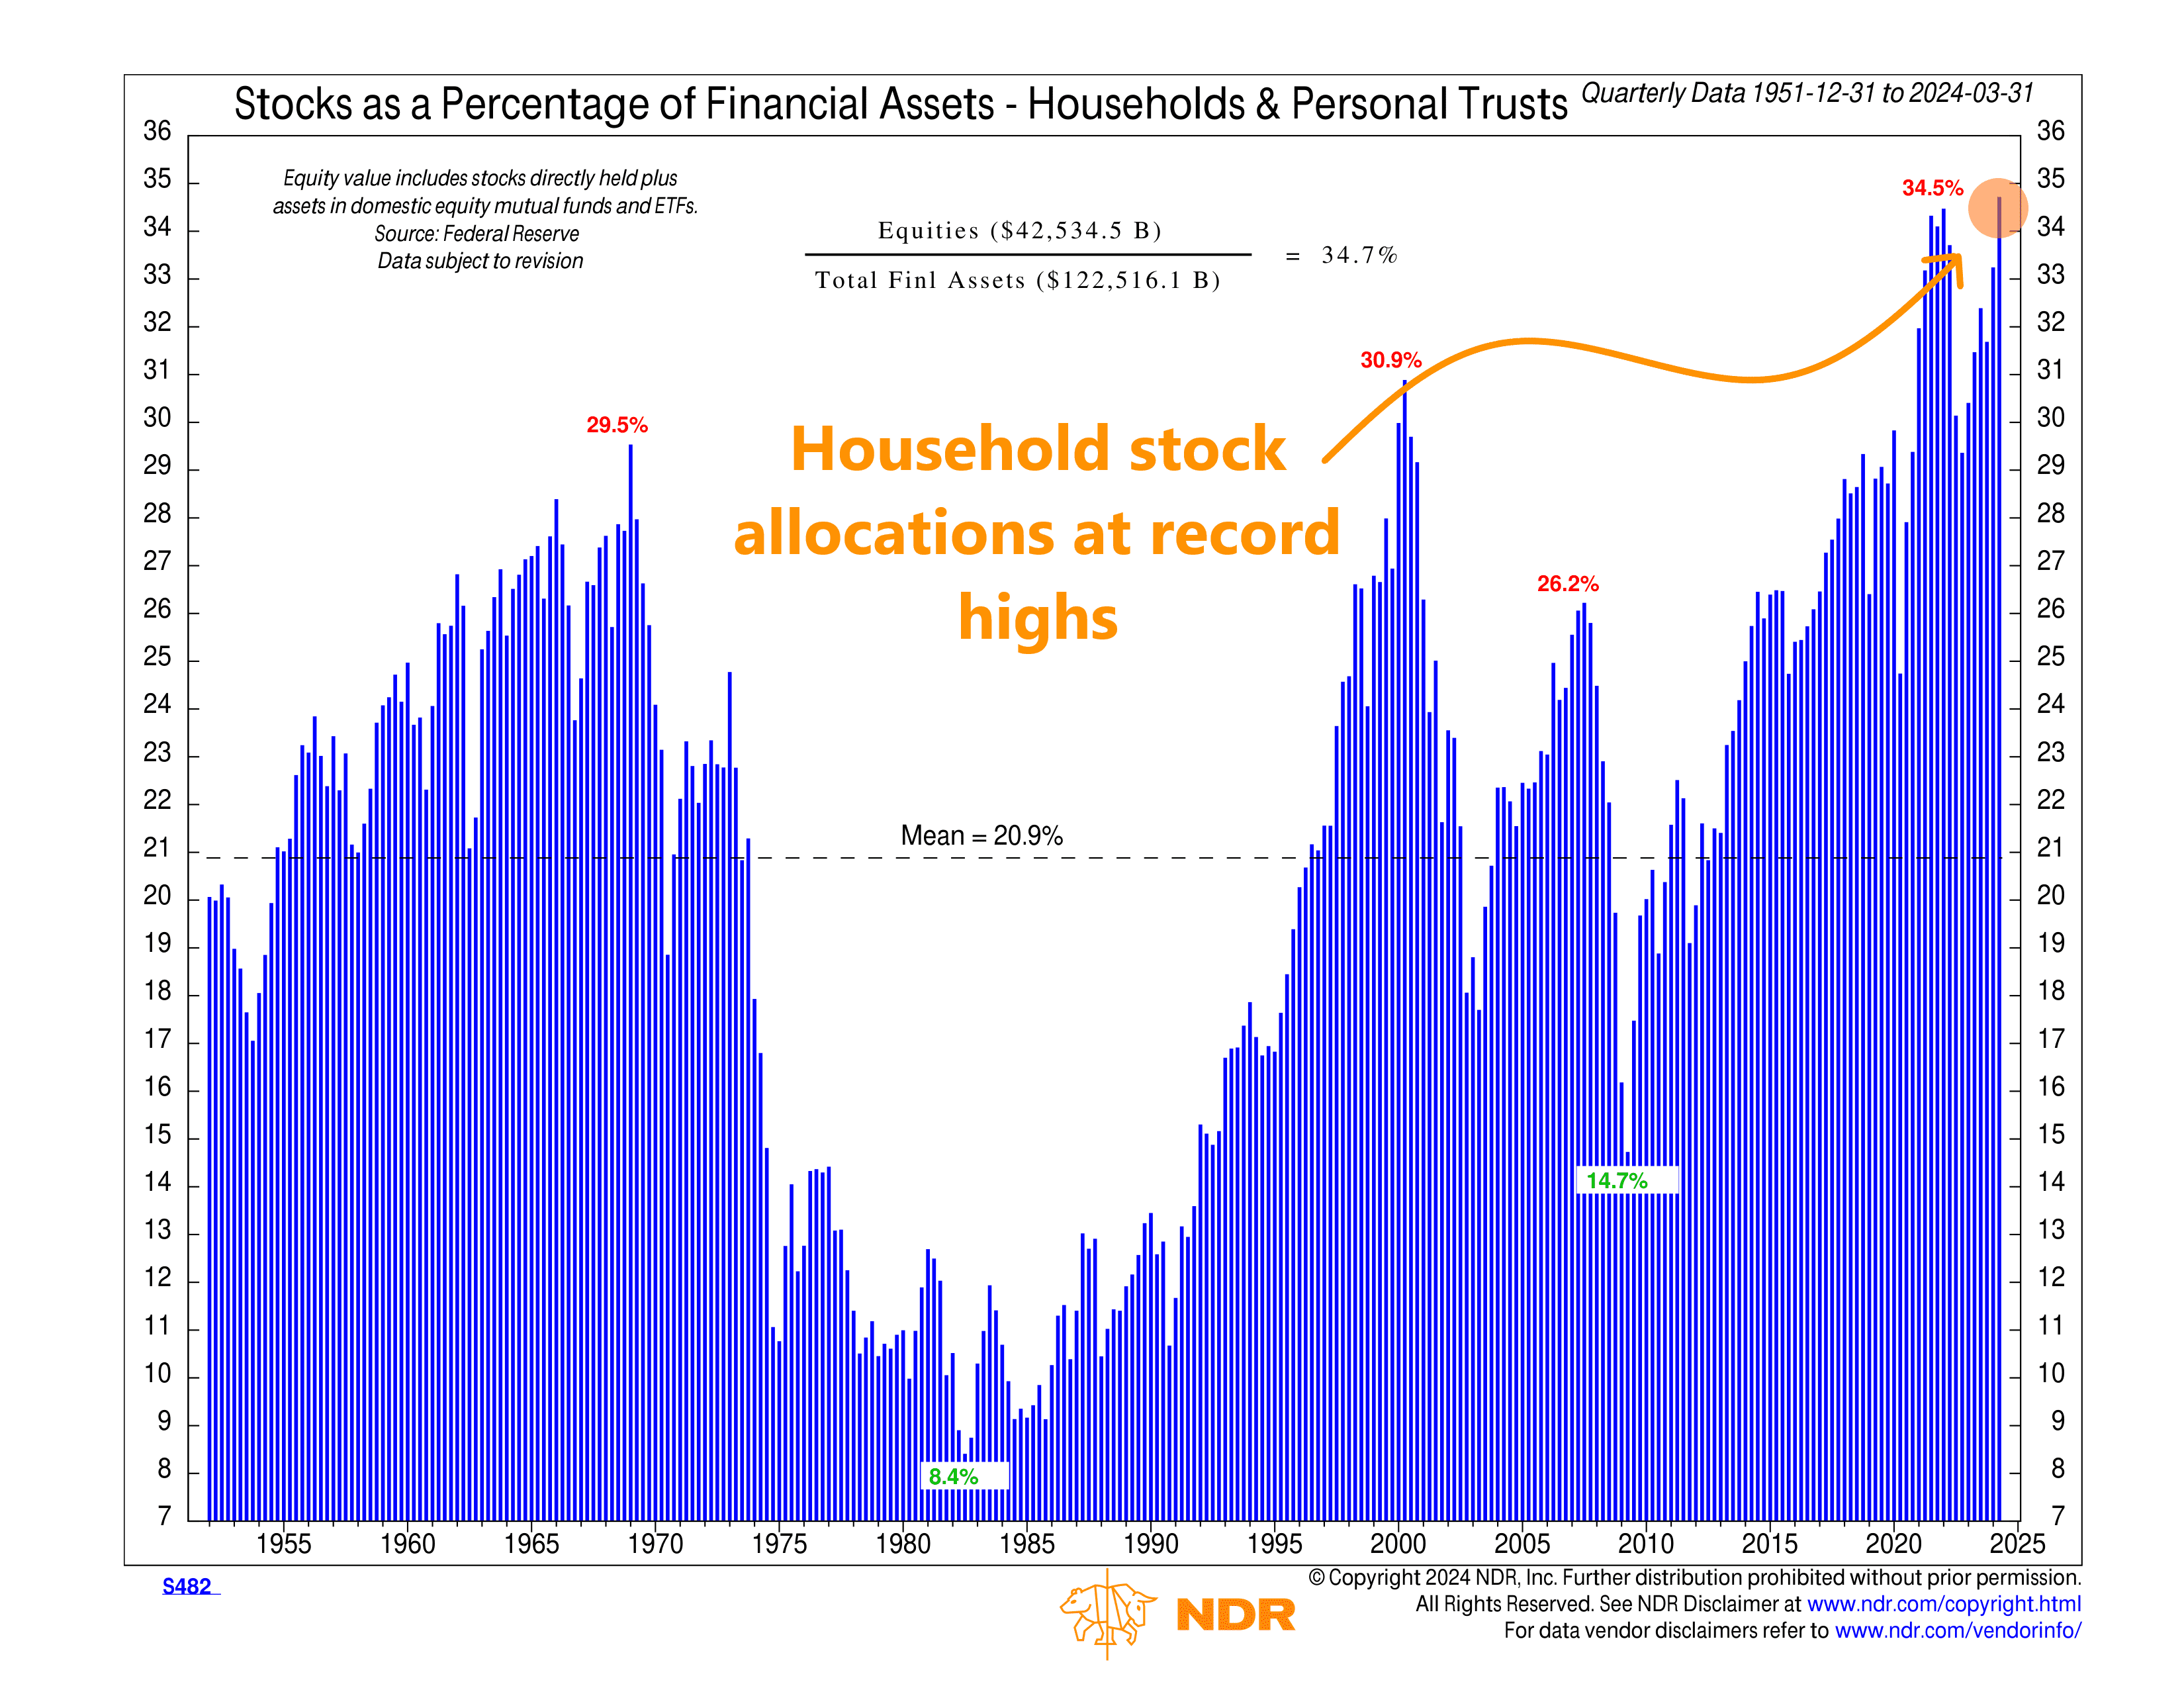
Specifically, the indicator above measures stocks as a percentage of household financial assets, revealing how much households are allocating to stocks, both directly and through equity mutual funds.
As you can see, it has fluctuated quite a bit over the past 70+ years. But for the most part, the proportion of household financial assets invested in stocks has moved in cycles that mirror the stock market’s performance, with very high stock holdings associated with market peaks and low stock allocations associated with market bottoms.
The average percentage since 1955 has been about 21%. Following the COVID-19 pandemic, this percentage surged to a record high of 34.5% before dipping to around 29% in 2022. However, according to the latest quarterly report, household stock allocations have soared back to nearly 35%, hitting an all-time high once again.
The problem? This is a sign of excessive optimism, and excessive optimism tends to correlate with market peaks, as it implies lower investor liquidity (i.e., no one left to buy if everyone has already bought). Historically, the data suggests that stocks struggle when household stock allocations are at record highs and investor sentiment is stretched.
To put some numbers on it, historically, when household stock allocations have been in the highest 20% quintile, the average annualized gain for the S&P 500 ten years later has been just 4.5%, compared to over 16% when in the lowest 20% quintile.
Does this mean stocks are destined to crash tomorrow? No, of course not. But it is a new piece of evidence that suggests risks are starting to build in the marketplace. When investor sentiment gets to extreme levels like this, it can leave the market more vulnerable to a pullback.
In other words, investors have confidently pushed all their chips to the center of the table, but with that bold move comes heightened risk.
This is intended for informational purposes only and should not be used as the primary basis for an investment decision. Consult an advisor for your personal situation.
Indices mentioned are unmanaged, do not incur fees, and cannot be invested into directly.
Past performance does not guarantee future results.
The S&P 500 Index, or Standard & Poor’s 500 Index, is a market-capitalization-weighted index of 500 leading publicly traded companies in the U.S.