OVERVIEW
The U.S. stock market registered moderate gains on a holiday-shortened week last week. While the Nasdaq was flat—remaining unchanged—the S&P 500 gained 0.61%, and the Dow rose 1.45%.
Value stocks outperformed, gaining 1.18%, whereas growth stocks rose just 0.28%. Small-cap stocks did well, increasing around 0.8% for the week.
As for foreign markets, it was a relatively flat week for developed markets. Emerging markets, however, rose about 0.93%. The U.S. dollar strengthened nearly 0.4%.
The bond market traded slightly lower for the week, as the 10-year Treasury rate settled around 4.26% by Friday’s close. Long-term Treasuries dipped about 0.75%. Overall, the bond market was down about 0.15%.
Commodities fell about 0.6% last week. This was primarily driven by a 3.5% drop in corn prices and a 0.66% fall in gold prices. Oil, however, rose around 3.4%. And finally, real estate prices remained mostly flat for the week, dipping just 0.04%.
KEY CONSIDERATIONS
The Glad Game – In the 1913 novel by American author Eleanor Porter, the 11-year-old orphan Pollyanna plays a game. She calls it “The Glad Game.” The idea is to find something to be glad about in every situation, no matter how difficult.
In a nutshell, it embodies extreme optimism. But while this philosophy is an excellent guide for living, it’s not so great for investing in the stock market.
Why? Because history suggests that when investors get too optimistic, things can turn sour. A little optimism is good; too much, and it gets you in trouble.
Here’s what I mean. The chart below is what we call our Investor Behavior model. It’s essentially a combination of several different indicators that look at the market in a contrarian way. When the indicators are optimistic, it’s actually bad for stock returns, and vice versa.
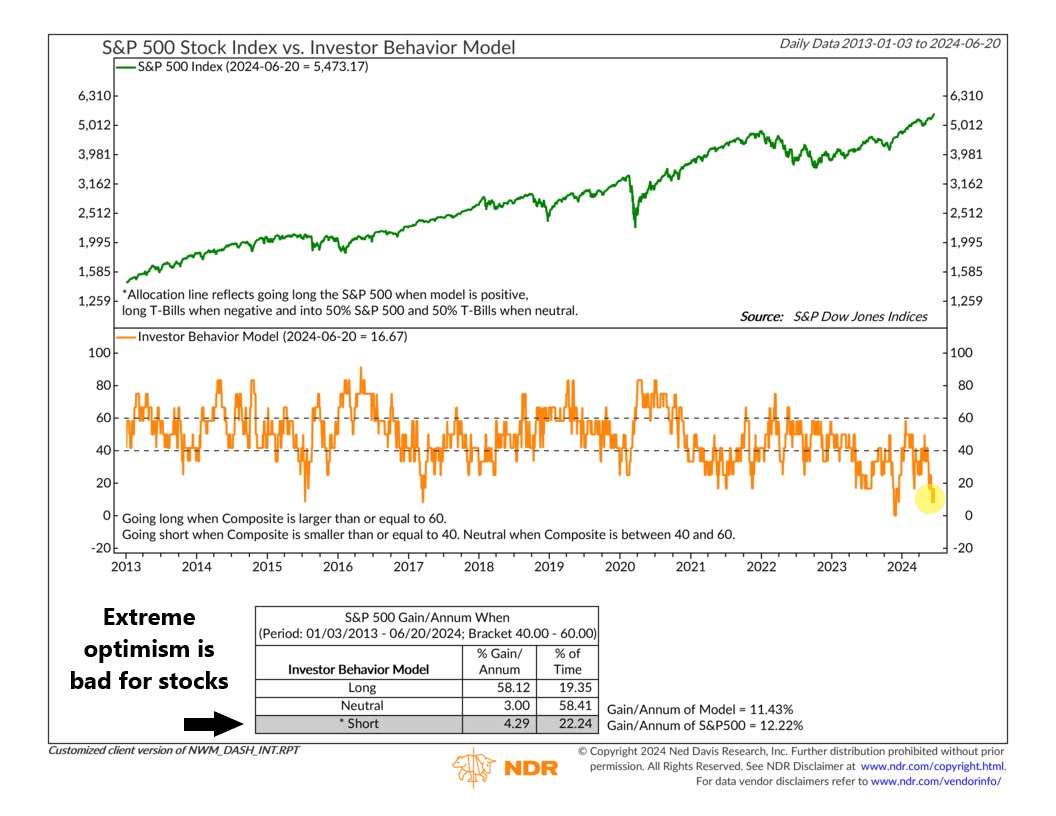
As you can see, very high readings for the model (extreme pessimism) are associated with strong stock market returns. Whereas very low readings (extreme optimism) are associated with below-average returns.
Right now, the model is near its lowest on record, meaning investors are feeling way too good about the stock market. Historically, the S&P 500 has gained around 4% per year, on average, when this has been the case. That’s not bad, but it’s much lower than the long-run average of 12% over the past ten years—and basically equivalent to what you could get from a safer government bond right now.
What’s driving the model to such low levels?
This next chart has an answer. It’s an indicator that surveys how investors feel about the market—the Crowd Sentiment Poll—and measures the number of consecutive days it’s been in the upper excessive optimism zone.
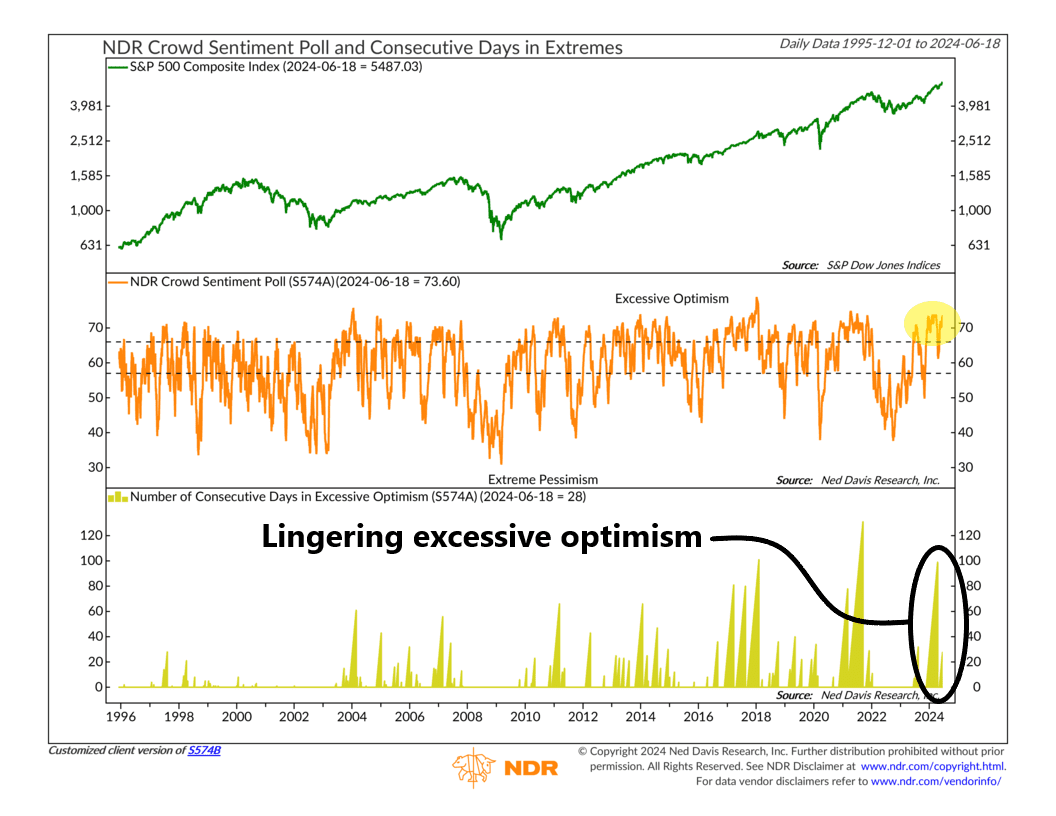
In April, the poll completed its third-longest streak on record in the excessive optimism zone. After a brief hiatus, that optimism has returned.
The problem with all this is that the longer optimism remains high, the greater the risk that it will turn into complacency and leave the market vulnerable to the next piece of negative news.
Take this final chart, for example. It shows the S&P 500 (top clip) and the NYSE Advance-Decline Line (bottom clip), a tool we use to show stock market breadth. When it’s falling—like it is now—and the market is rising, it’s called a divergence. This is a sign that weakness is forming beneath the surface—a vulnerable position for the market to be in.
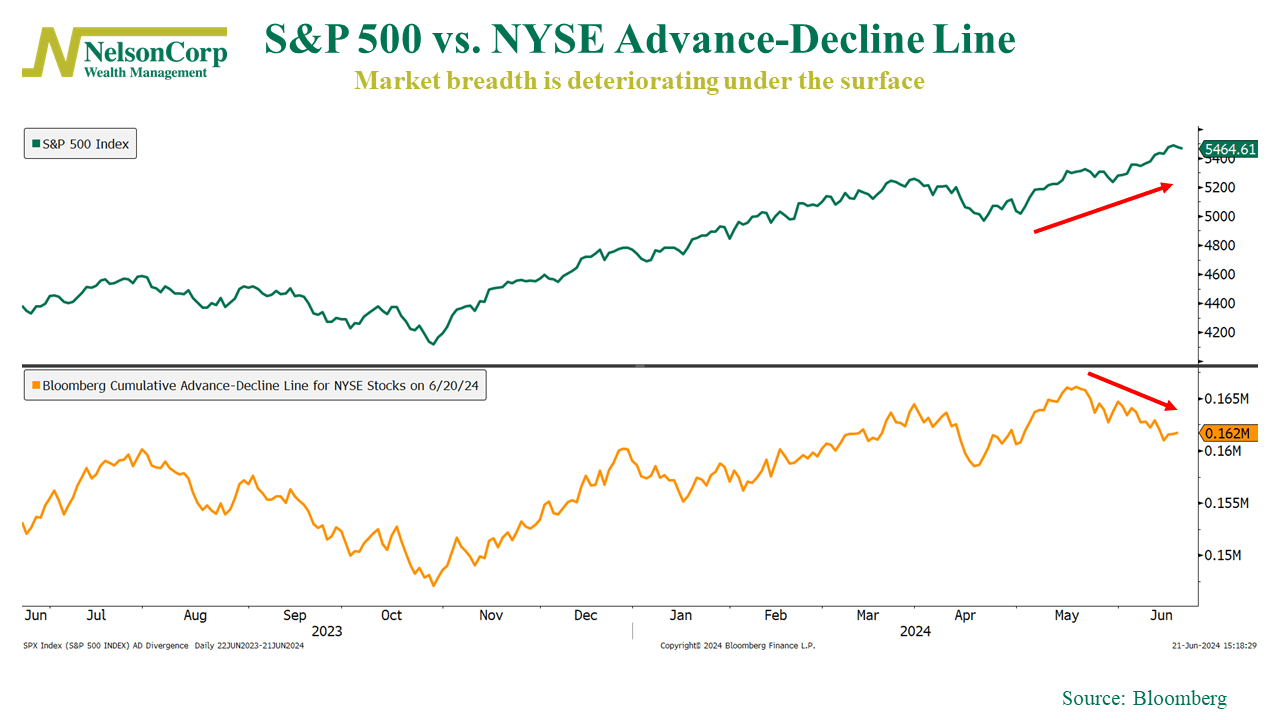
The implication? If the market decides to take another breather soon, it could end up being worse than the minor 5% pullback we saw in April, as fewer and fewer stocks are participating, and there is way too much optimism among investors. This is probably one of the biggest risks looming over markets right now.
This is intended for informational purposes only and should not be used as the primary basis for an investment decision. Consult an advisor for your personal situation.
Indices mentioned are unmanaged, do not incur fees, and cannot be invested into directly.
Past performance does not guarantee future results.
The S&P 500 Index, or Standard & Poor’s 500 Index, is a market-capitalization-weighted index of 500 leading publicly traded companies in the U.S.