OVERVIEW
We saw a lot of green in financial markets last week. All three major U.S. indices closed higher, with the S&P 500 increasing 1.54%, the Dow gaining 1.24%, and the Nasdaq surging 2.11%.
Large caps led the way, increasing 1.73% versus a 1.08% gain for small-cap stocks. Additionally, growth stocks outperformed value, rising 1.85% versus 1.28%.
Overseas, developed country stock markets rose 1.5%, and emerging markets gained 2.63%. The U.S. dollar dipped about 0.6% relative to the world’s major currencies.
Overall, the bond market did well on the back of a falling 10-year Treasury rate, which dropped to 4.43%. Broadly, bond prices increased about 0.55%.
Real assets had a good week, too, with both real estate and commodities surging roughly 2.5%. Specifically, oil rose 2.2%, gold increased 1.97%, and corn prices dropped 3.7%.
KEY CONSIDERATIONS
Don’t Stop Me Now – The theme for the stock market this year has been like that Queen song, “Don’t Stop Me Now.”
Why? Because it’s been having a good time… having a good time…
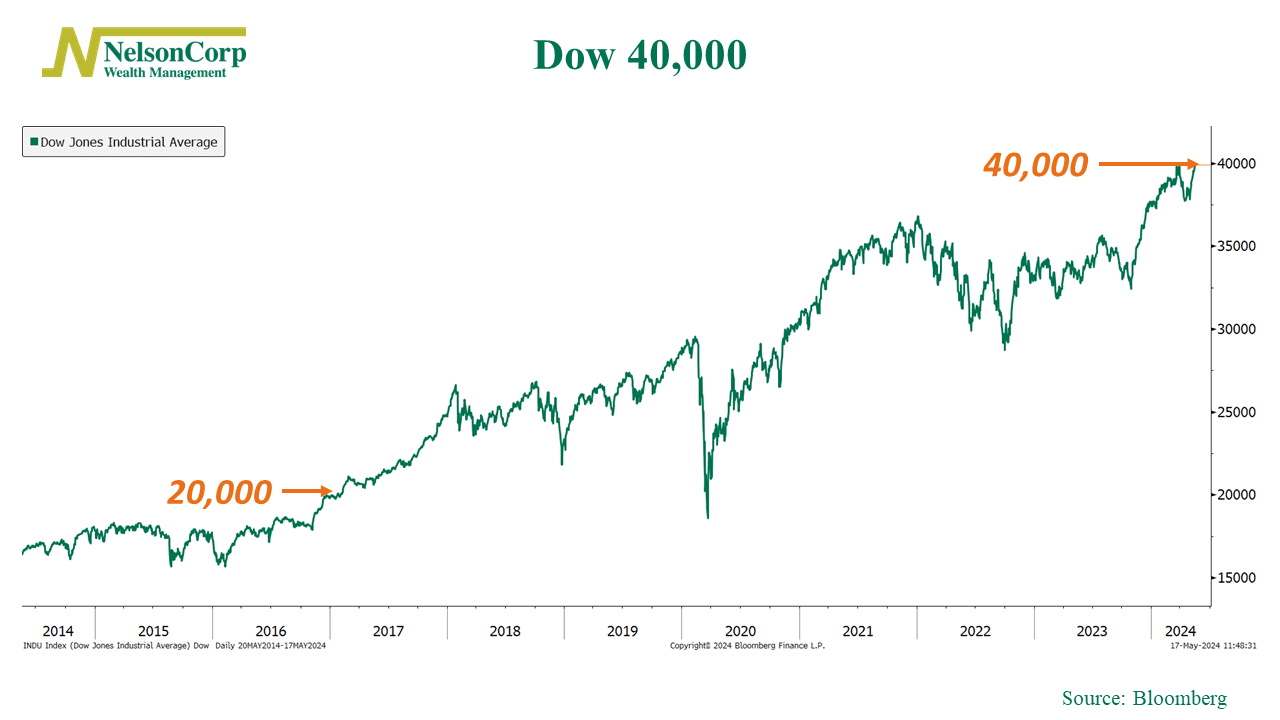
But seriously, just look at the Dow Jones Industrial Average. As we pointed out in our Chart of the Week, it climbed above 40,000 for the first time ever.

That’s the type of price action you tend to only see in a bullish, upward-trending market.
But what’s interesting is that it’s happening despite cooling economic data.
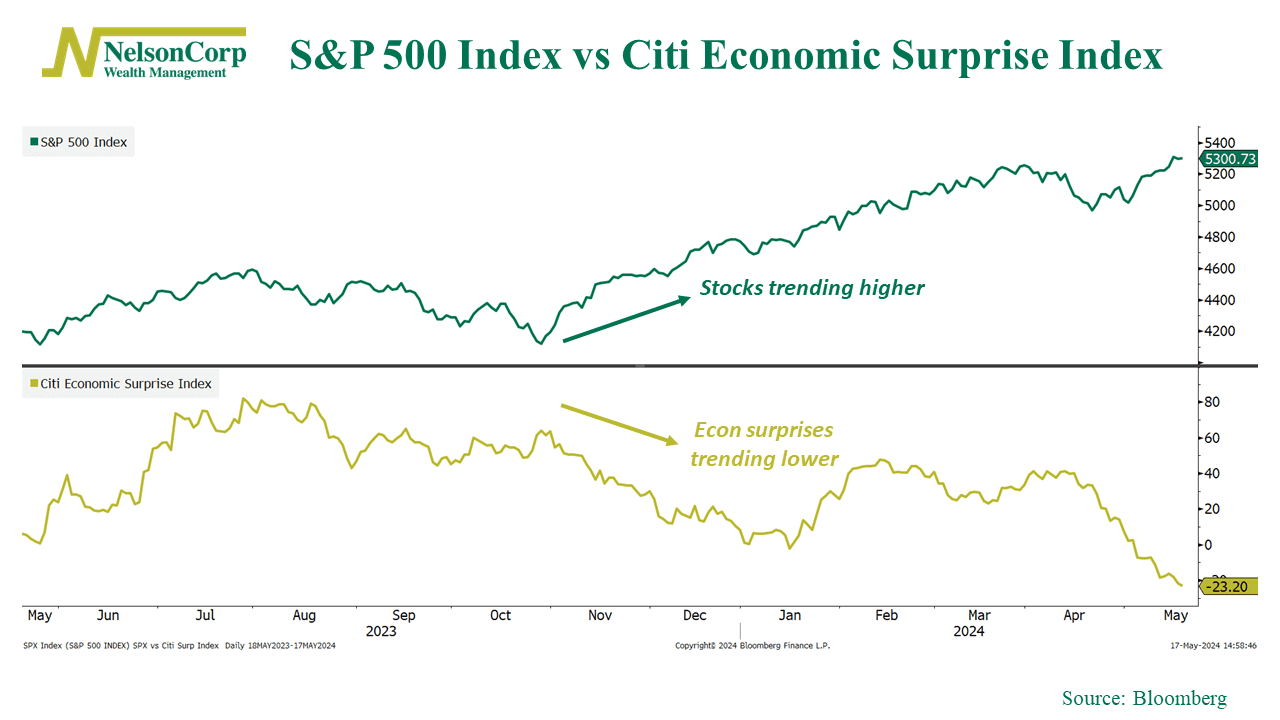
Specifically, the rate at which economic data has been surprising analysts to the upside is falling. We measure this in an index called the Citi Economic Surprise Index, shown below.

Up until the last few months of last year, the S&P 500 Index and the Citi Economic Surprise Index had been moving in line with each other. But then they parted ways: the Econ Surprise Index started trending lower, and the S&P 500 kept trending higher.
Basically, the stock market was saying, don’t stop me now; I’m having a good time! It didn’t matter that the latest economic data was no longer stronger than expected. The stock market wanted to go higher—so it did.
Now, to be sure, our analysis does show that if the Citi Economic Surprise Index continues down this path, it will eventually affect stock prices in a negative way. This will be something to keep an eye on as we enter the summer months. But for now, it appears the economic data has been coming down the pipeline in a way that is mostly neutral for stocks—and that’s okay.
In fact, it’s probably a sign that we are entering a pretty “normal” period for the stock market (if any period in the stock market can ever be labeled as normal).
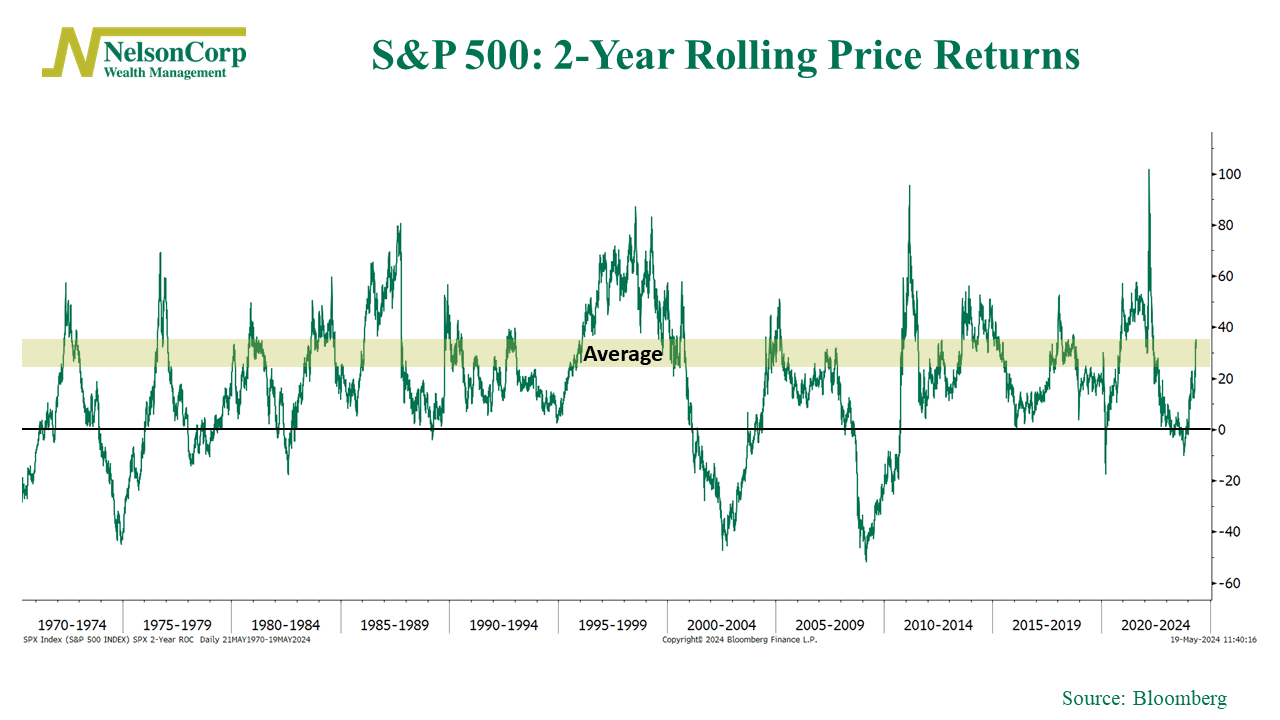
For example, looking at a chart of the S&P 500’s rolling 2-year price returns (shown below), we see that the stock market has a pretty great track record of being profitable over any 2-year period, with an average long-run return of around 20%.

As you can see, while the 2-year rolling return took a hit after 2022, it has since rebounded, and we are right back in the middle of the long-run average.
The bottom line? Unless you think we are about to enter one of those big rough patches, where rolling 2-year returns drop to -40% or more, it probably makes sense to listen to history here and own U.S. large-caps for the long term.
This is intended for informational purposes only and should not be used as the primary basis for an investment decision. Consult an advisor for your personal situation.
Indices mentioned are unmanaged, do not incur fees, and cannot be invested into directly.
Past performance does not guarantee future results.
The S&P 500 Index, or Standard & Poor’s 500 Index, is a market-capitalization-weighted index of 500 leading publicly traded companies in the U.S.
The Dow Jones Industrial Average (DJIA) is a price-weighted index composed of 30 widely traded blue-chip U.S. common stocks.
Citigroup Economic Surprise Index represents the sum of the difference between official economic results and forecasts. With a sum over 0, its economic performance generally beats market expectations. With a sum below 0, its economic conditions are generally worse than expected.
