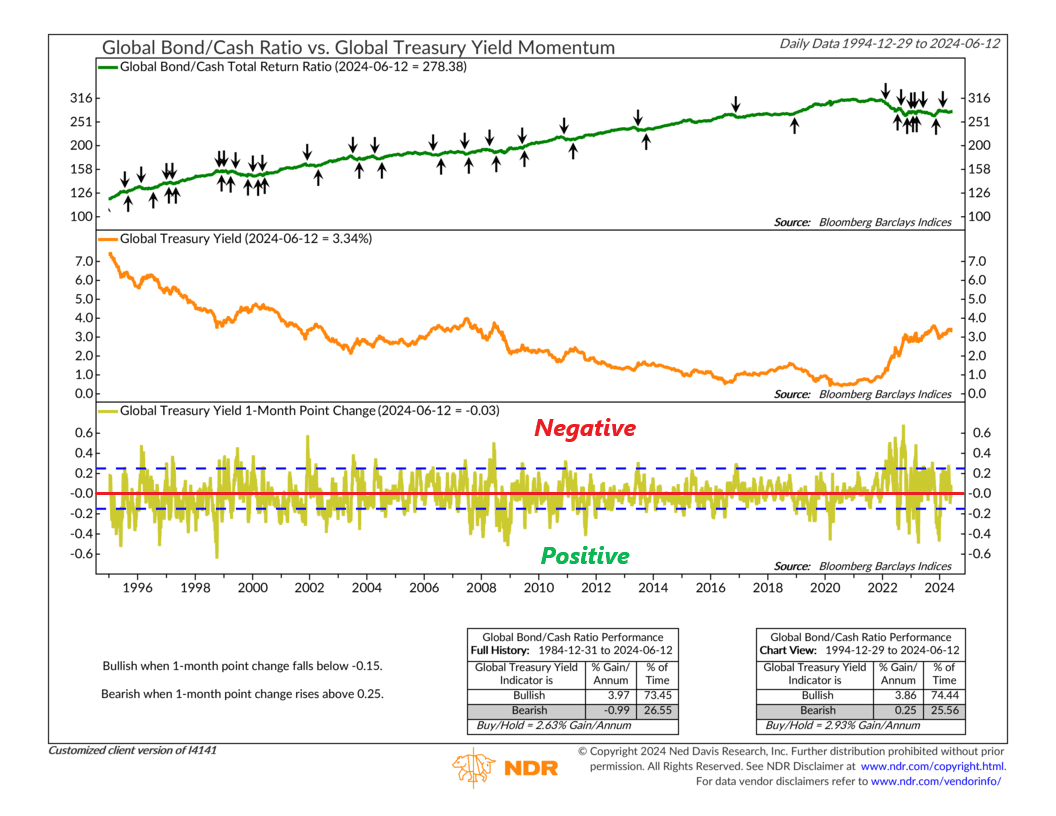
This week’s featured indicator is kind of like a wrench. When you turn a wrench, it creates a force called torque that helps move an object. But in this case, global treasury yields are the wrench, and the object being moved is the global bond/cash ratio.
Let me explain. The top clip of the chart above is the ratio of bond returns to cash returns. When this line rises, it means bonds are outperforming cash—and vice versa. In the middle clip is a measure of global treasury yields. Movements in global treasury yields affect the bond/cash ratio. But how do we quantify this?
That’s where the measure on the bottom clip comes into play. This is our wrench. It measures the 1-month point change in global treasury yields. As you can see, it tends to oscillate around the red line (representing no change). But when the wrench gets cranked too high or low, it creates a trend shift in the global bond/cash ratio.
According to the indicator, when the 1-month point change in global treasury yields rises by 0.25 or more, it signals a negative signal for the bond/cash ratio (meaning bonds are set to underperform cash). On the flip side, when the 1-month point change in global treasury yields falls by -0.15 or more, it triggers a positive signal for the bond/cash ratio (meaning bonds are set to outperform cash).
In other words, when global treasury yields rise quickly, it’s bad for bonds (and good for cash)—and when global treasury yields fall quickly, it’s good for bonds (and bad for cash).
That’s it. It’s fairly simple but also useful because it can be used to make portfolio allocation decisions between bonds and cash.
For example, in 2022, global treasury yields started rising rapidly. The 1-month point change reached sky-high levels. You can see how the wrench was cranked to the max, generating sell signals for bonds. Momentum was on the side of cash, and cash was indeed the better investment option during this period.
Today, however, yields have settled down quite a bit. While the indicator is still on the “sell” signal for bonds from earlier this year, the 1-month momentum change is now slightly negative. Reaching that lower dashed line (representing a -0.15 change) would generate a “buy” signal for bonds relative to cash. In other words, bonds could finally start outperforming, so this will be one indicator to watch closely in the coming months.
