OVERVIEW
After a choppy week of trading, the major U.S. stock indices ended with moderate losses. The Dow slipped 0.6%, the Nasdaq declined 0.18%, and the S&P 500 inched down 0.04%. Small-cap stocks fared the worst, dropping around 1.3% for the week.
International markets showed mixed results. Developed markets declined by 0.34%, while emerging markets managed a slight gain of 0.21%.
Bonds had a tough week as well, with the benchmark 10-year Treasury yield climbing to 3.95% from 3.79% the previous week. Overall, the bond market fell by approximately 0.8%.
On the brighter side, commodities performed well, gaining about 0.8% overall. Oil led the charge, rising 3.9%. Gold edged up 0.15%, and corn saw a modest increase of 0.3%. Real estate dipped 0.2%, while the U.S. dollar remained unchanged for the week.
KEY CONSIDERATIONS
Drawdowns Are Normal – Phew! That was quite the week. After Monday’s selloff, the S&P 500 Index was nearly 8.5% below its all-time highs.
But then it recovered. By the end of the week, the drawdown narrowed to -5.7%.

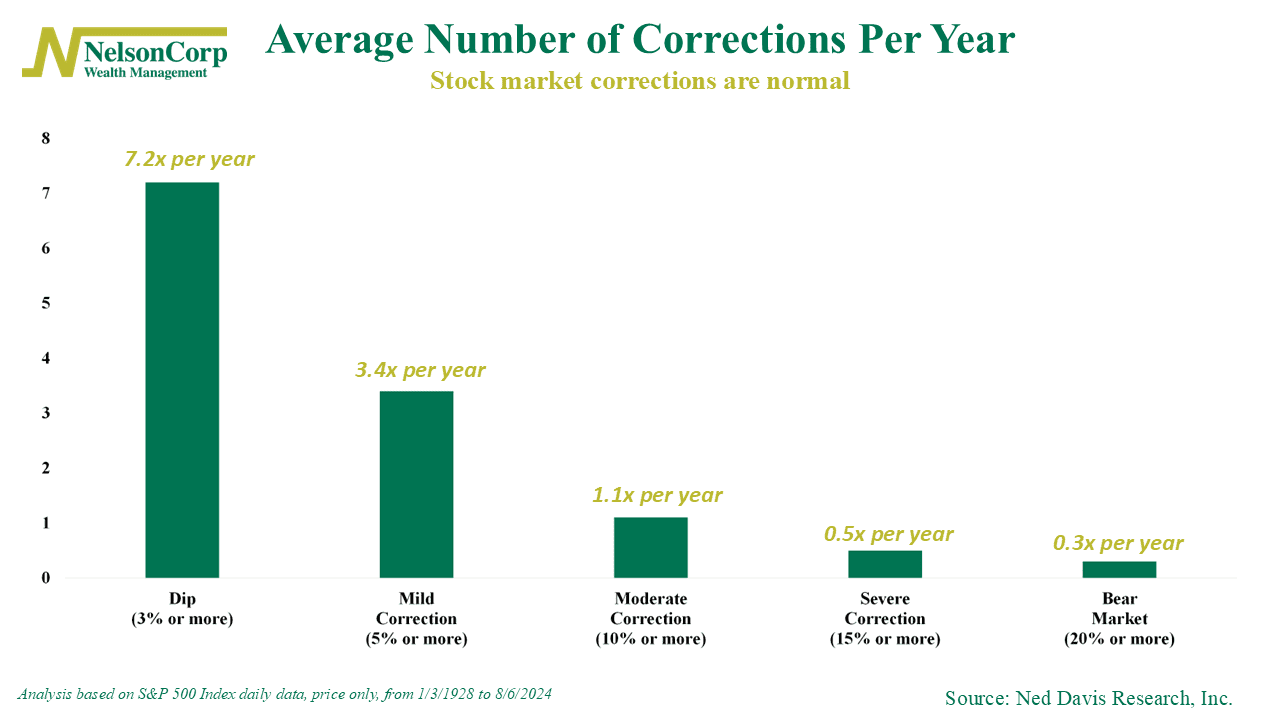
But here’s the thing to remember: drawdowns are normal.
As the chart below shows, a mild correction (5% or more drop) happens roughly 3.4 times a year. A moderate correction (10% or more) happens about 1.1 times a year.

So again, drops in the market happen. It’s normal. It’s the big drops—the severe corrections and bear markets—that you need to worry about.
So, are we in for one of those?
Well, we can’t say for sure. Our modeling suggests that, at the very least, the market will likely remain choppy for some time. But the good news is that we do see some encouraging signs from credit markets.
For example, as this next chart shows, although we witnessed a massive spike in volatility (the VIX Index) last week, credit spreads—the difference between riskier high-yield bonds and safer U.S Treasuries—saw a much smaller spike.

Normally, when one of these goes up a lot, the other tends to follow by a similar degree. But so far, the move in credit spreads has been fairly mild.
We take this as a sign that the selling in the market last week had more to do with technical factors than with any fundamental issues in the underlying economy.
With all that said, though, I don’t want to understate the risks. There is still a lot of concern among investors that the economy might be slowing down too much.
For instance, this final chart is one of the most important charts of the moment. It shows the U.S. unemployment rate since 1968 on the top clip and the year-to-year point change in the unemployment rate on the bottom.

Just stare at it for a second. Notice anything?
That’s right. The unemployment rate tends to trend—a lot. Historically, once it has hit bottom and turned the corner, it has always trended higher.
Oh yeah, and that bottom clip? It shows that every time the unemployment rate has been rising at a yearly rate that is higher than its long-run average, it has entered an economic recession.
In other words, since the 1970s, the unemployment rate has never risen at a pace this far above its historical average and NOT been accompanied by an economic recession.
The good news, though, is that our risk models are watching closely and will alert us if more serious action is needed. In the meantime, it’s important to remember while market drops are unsettling, they’re a normal part of investing.
This is intended for informational purposes only and should not be used as the primary basis for an investment decision. Consult an advisor for your personal situation.
Indices mentioned are unmanaged, do not incur fees, and cannot be invested into directly.
Past performance does not guarantee future results.
The S&P 500 Index, or Standard & Poor’s 500 Index, is a market-capitalization-weighted index of 500 leading publicly traded companies in the U.S.
