OVERVIEW
Stocks were mixed last week. The S&P 500 eked out a moderate gain of 0.24%, and the Dow rose 0.94%, but the Nasdaq dropped 0.92%. Similarly, value stocks managed an increase of 1.26%, whereas growth stocks fell 0.66%. Small caps were essentially flat for the week.
Foreign stocks were mixed, too. Developed countries saw their markets gain 0.57%, whereas emerging markets dipped 0.07%.
The bond market had a tough week as the benchmark 10-year Treasury rate rose to 3.9% from 3.8% the week before. Overall, the bond market fell about 0.5%.
Real estate stayed positive for the week, gaining around 0.37%. However, commodities fell 0.38% broadly. This was dragged down by a 1.6% drop in oil prices. And finally, the U.S. dollar strengthened about 1.11% to end the week.
KEY CONSIDERATIONS
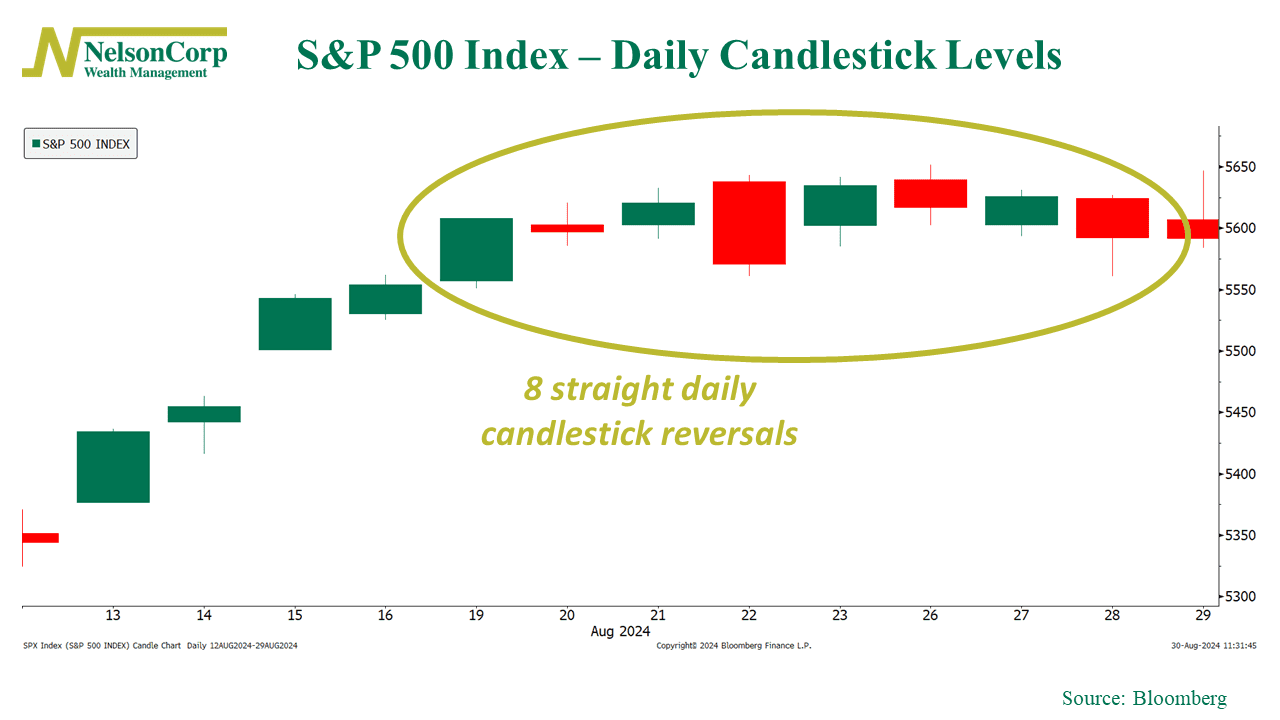
Red Zone – Up, down, up, down, up, down, up, down, and…down again. That’s what the S&P 500 was doing up until Thursday’s tiny decline broke the streak last week.
As you can see on the candlestick chart below, after a period of gains, the S&P 500 hit some choppy waters and went on a streak of eight daily reversals in a row.

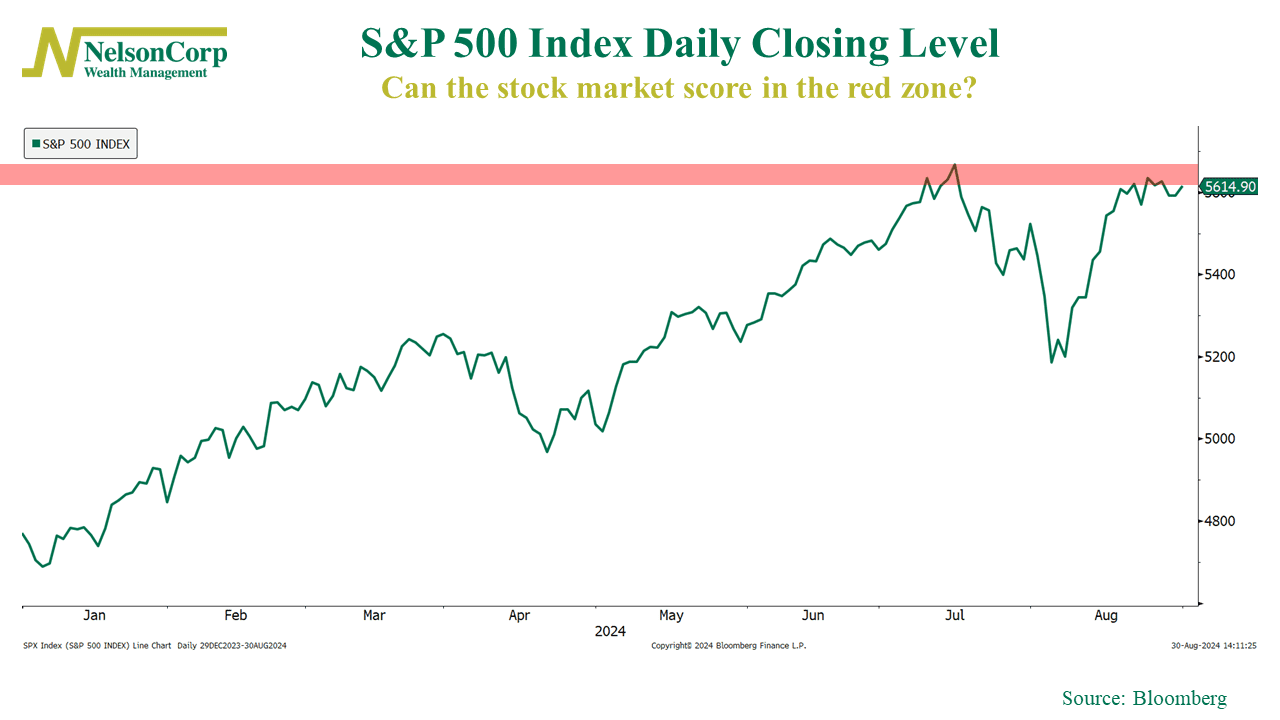
Technically, we’d call this “hitting resistance.” But since football season is here, I’ll put it in gridiron terms: It’s like being in the red zone—1st and goal on the 3-yard line—yet, play after play, the market is getting stuffed at the line, unable to make progress.

So, the drive has stalled for now. But will the market eventually break through this resistance and score?
It’s possible. If demand outpaces supply in the coming weeks, new record highs could be within reach. But it’s not guaranteed. In fact, our models suggest that the stock market is still in a risky position.
Why? Consider valuations, one of the key elements in our Investor Behavior component. It’s important because while the price action could look OK, if valuations are stretched, the model will have a harder time turning much more bullish.
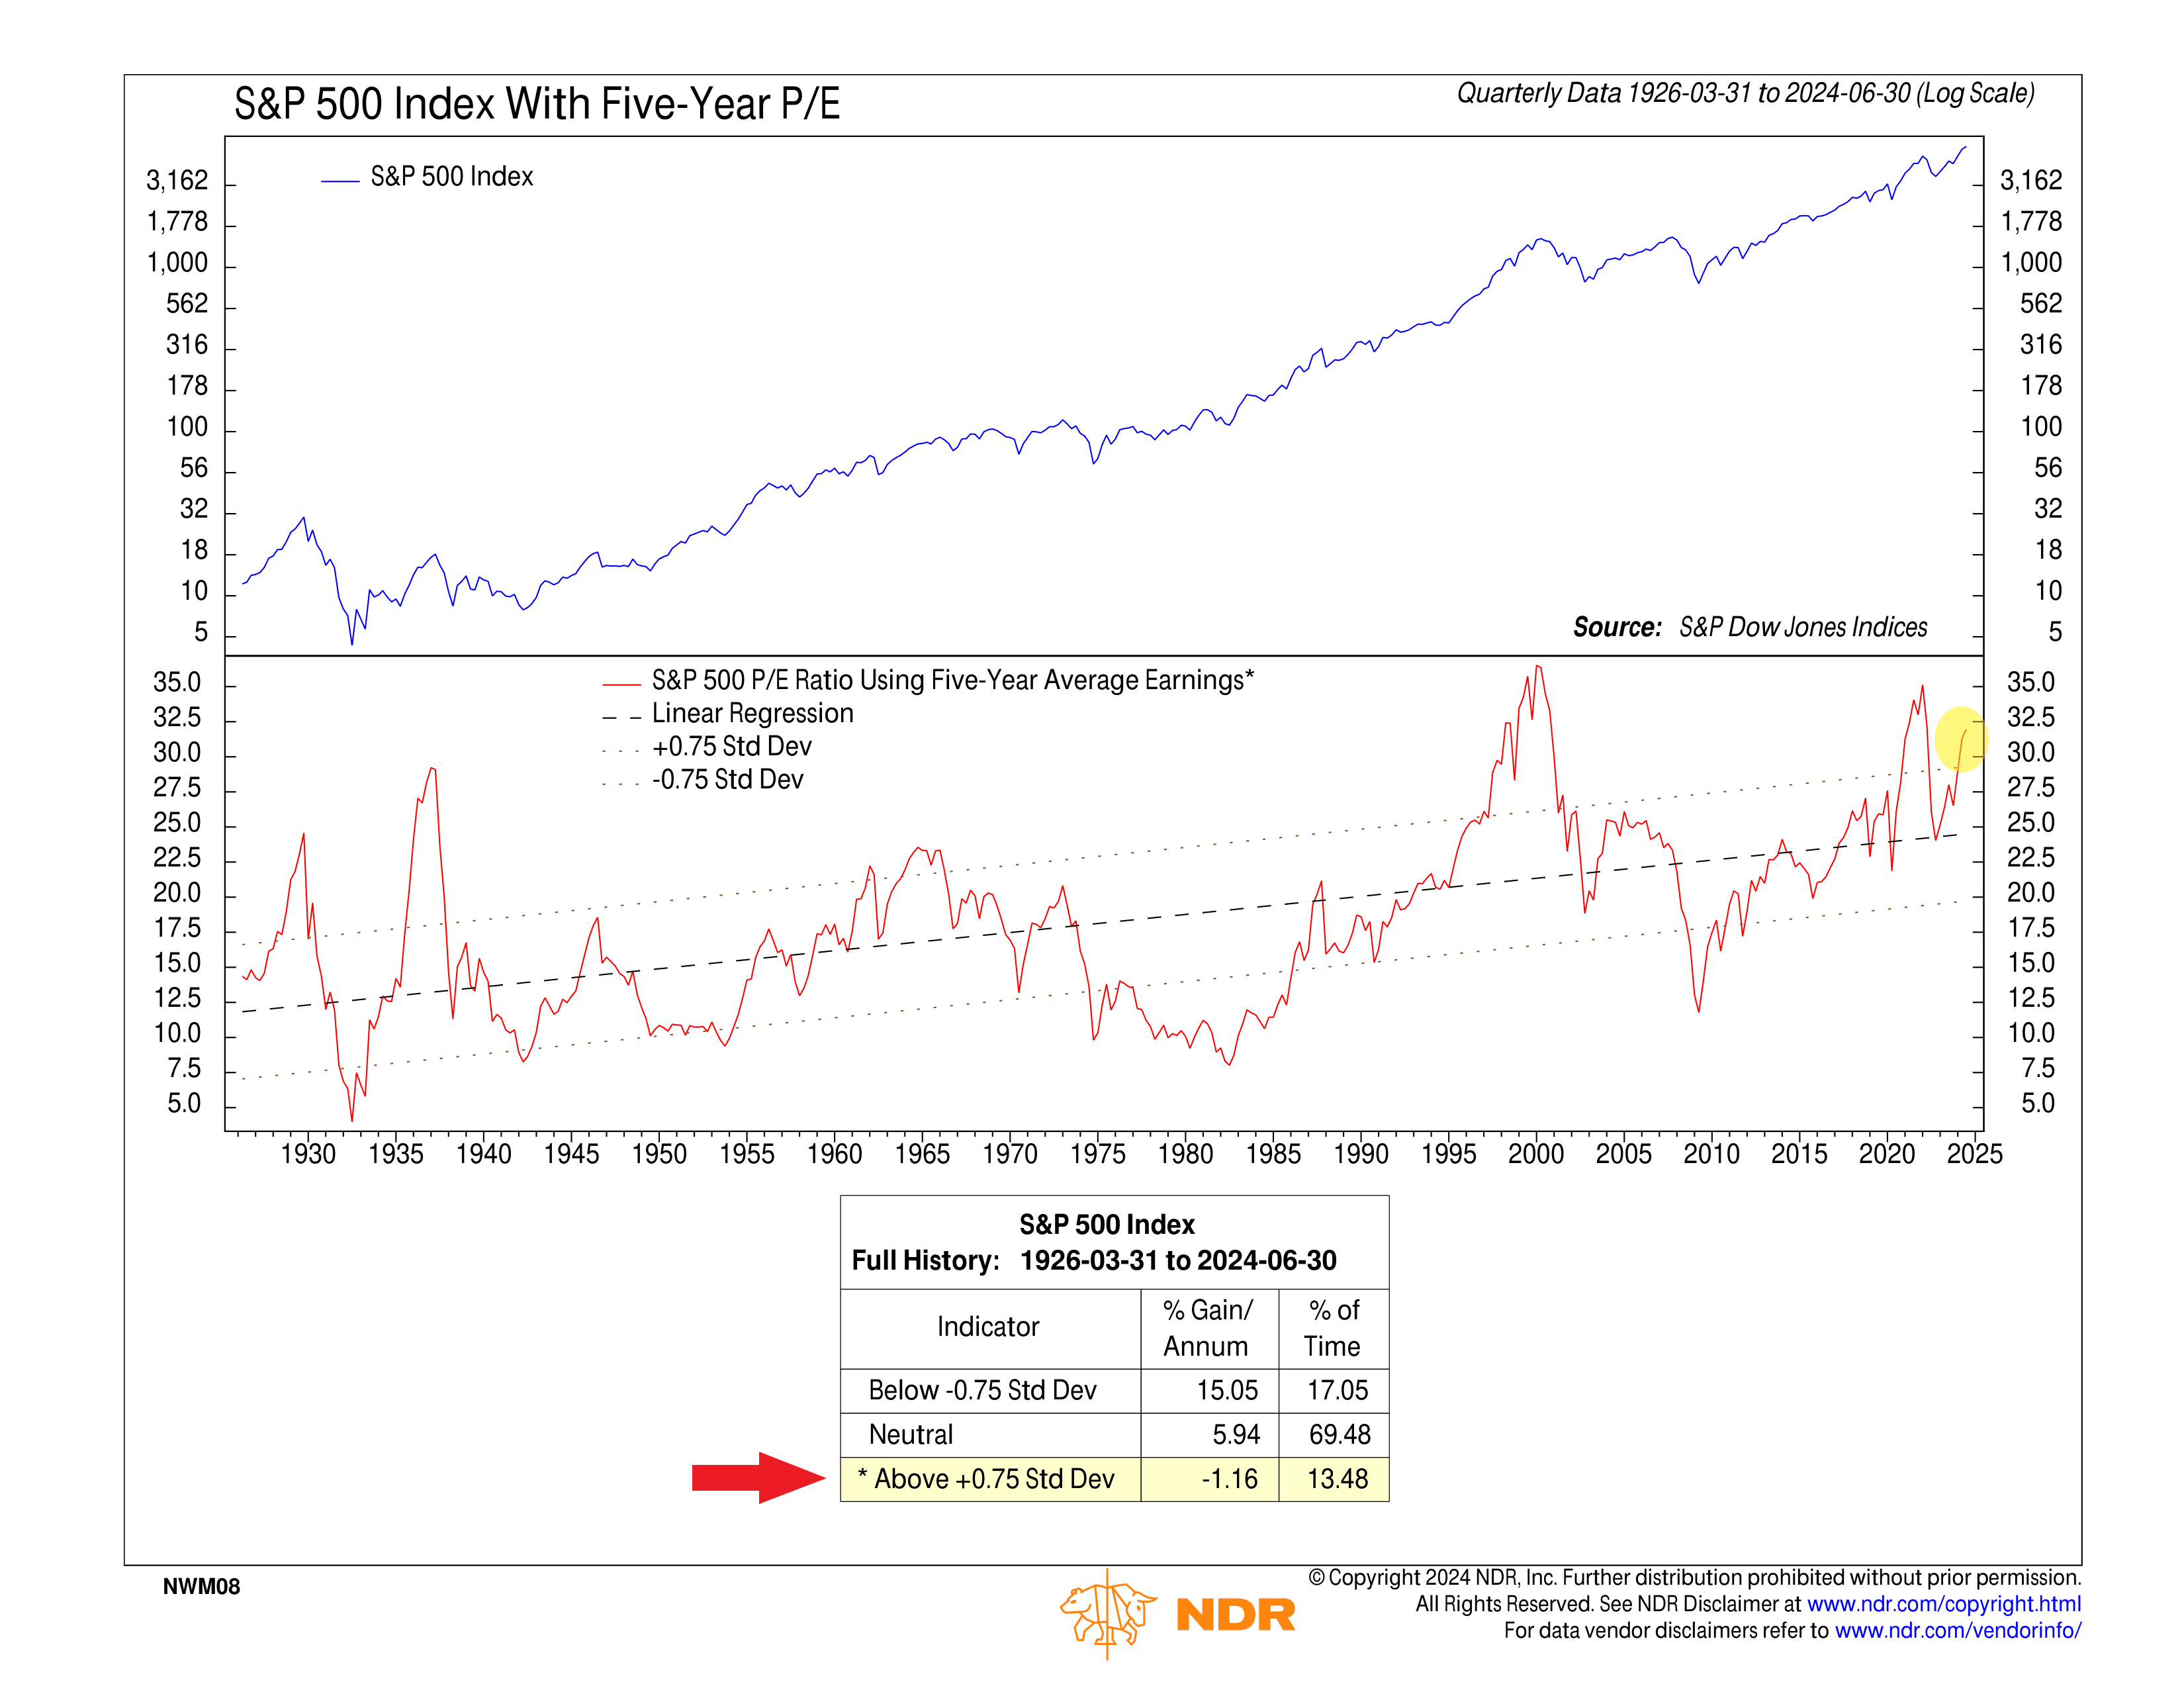
And right now, the evidence suggests the market is overvalued. Take this indicator, for instance. It compares the S&P 500’s price to its 5-year average earnings, but it also adjusts for the upward trend in valuations over time using a linear regression line.

As you can see, even with the trend adjustment, the S&P 500 is still overpriced relative to its 5-year average earnings. The numbers don’t lie. Historically, when the market is this overpriced, it has averaged negative returns.
The bottom line? The market needs to prove itself in the coming weeks. The rally might continue if it can break through this tough red zone defense. But, if it struggles to gain momentum, high valuations could weigh it down and cause another setback.
This is intended for informational purposes only and should not be used as the primary basis for an investment decision. Consult an advisor for your personal situation.
Indices mentioned are unmanaged, do not incur fees, and cannot be invested into directly.
Past performance does not guarantee future results.
The S&P 500 Index, or Standard & Poor’s 500 Index, is a market-capitalization-weighted index of 500 leading publicly traded companies in the U.S.
