This week’s indicator is all about that nasty word nobody likes: layoffs.
Why layoffs? Because when they start to rise, it can signal that the job market is cooling off—often before we see it in other stats like initial jobless claims. This makes it a useful leading indicator of the labor market and the economy.
Here’s how it works. Each month, the firm Challenger, Grey & Christmas, Inc. releases the Challenger Report, which counts the number of corporate layoffs announced. They gather data from state labor departments, giving us a clear picture of where the cuts are happening by industry and region.
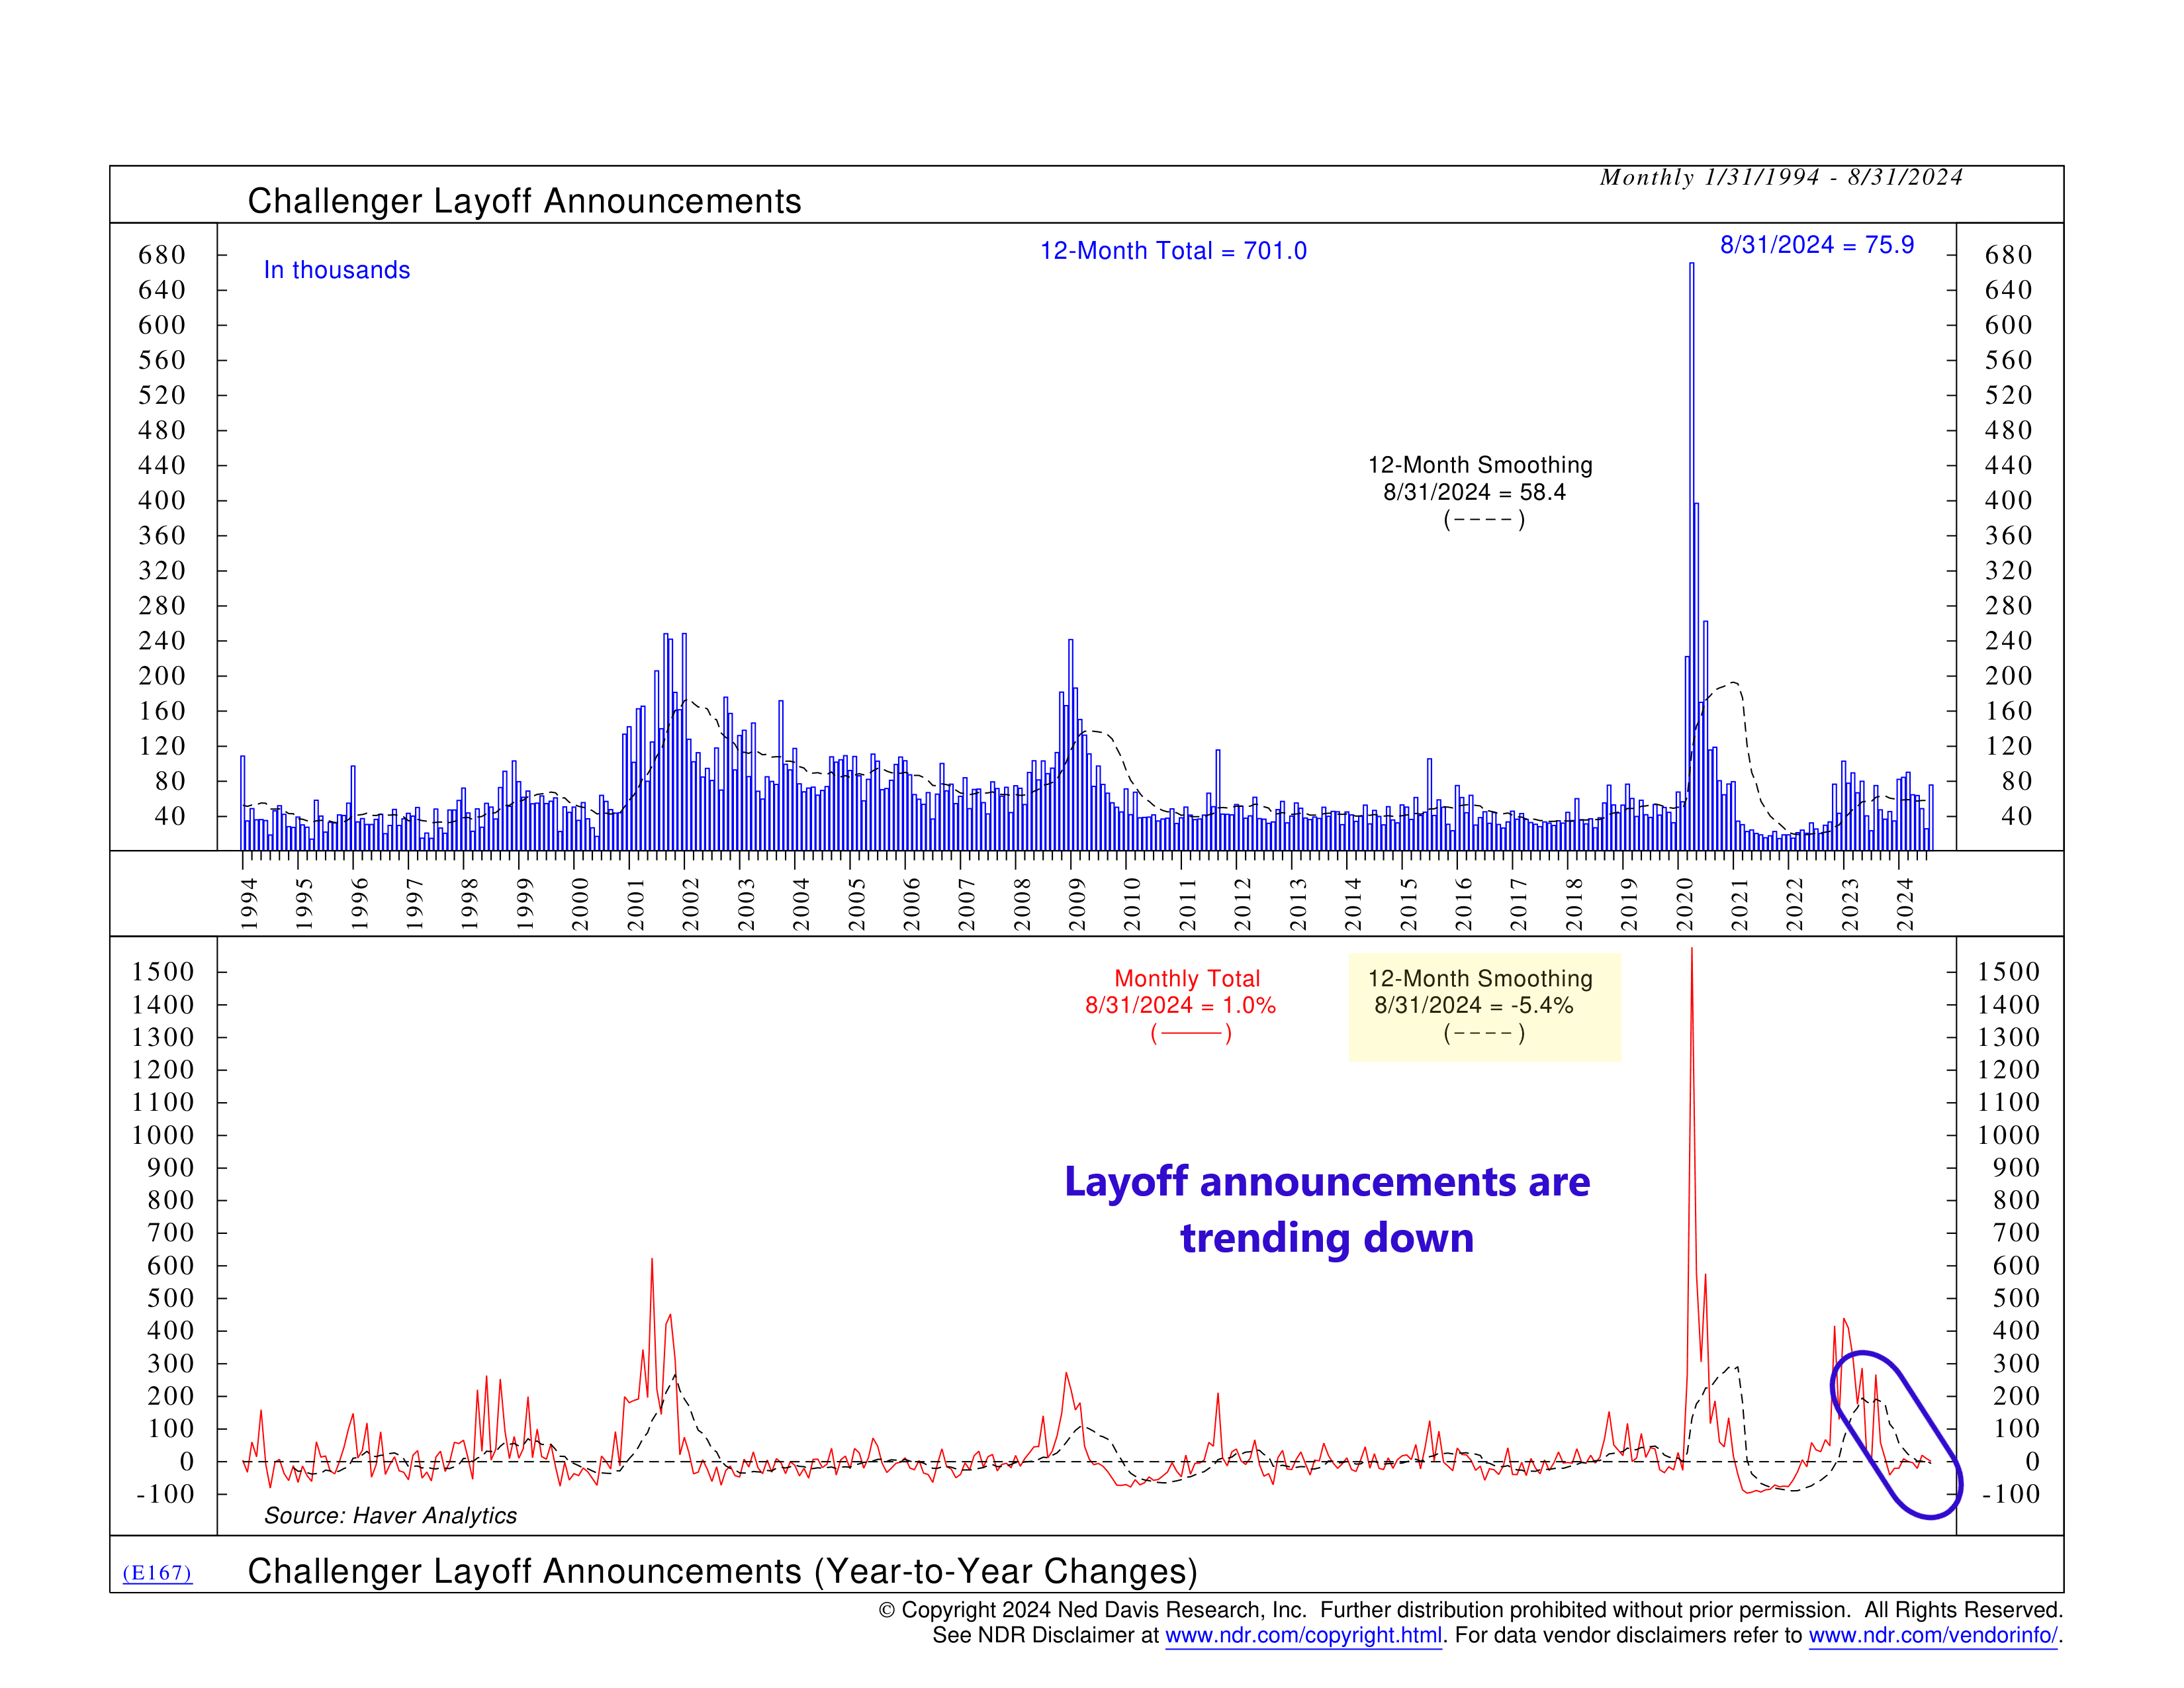
In the chart, the blue bars on top show the monthly number of layoffs along with the 12-month average. The red line below shows the year-to-year change in these numbers, with the dotted black line tracking the year-to-year change in the 12-month average.
It’s this year-to-year change in the 12-month average that we care about for the sake of this indicator. Why? Because not every announced layoff happens right away. Some layoffs might be delayed or even canceled. By focusing on the 12-month smoothed data, we can filter out some noise and smooth out the bumps caused by seasonality.
As for the signal itself, it’s pretty straightforward. When the year-to-year change in the 12-month smoothing is above zero, it’s a bad sign for the economy and the stock market. When it’s below zero, it’s good news. That’s it!
So, what’s the latest? In August, there were 75,900 layoffs, with a 12-month total of 701,000. While those numbers are higher than we’d like, they’re still far below the spikes we saw in 2020.
The good news? The year-to-year change in the 12-month average recently turned negative, down 5.4% compared to last year. This means that overall, layoffs have actually decreased over the past year.
So, the bottom line is that while other labor market signals might cause concern, layoffs suggest the job market is still holding up. Historically, this has been positive for the stock market.
However, it’s definitely worth keeping an eye on this indicator. If the numbers start to rise, it could be one of the first warning signs of trouble ahead.
This is intended for informational purposes only and should not be used as the primary basis for an investment decision. Consult an advisor for your personal situation.
Indices mentioned are unmanaged, do not incur fees, and cannot be invested into directly.
Past performance does not guarantee future results.
