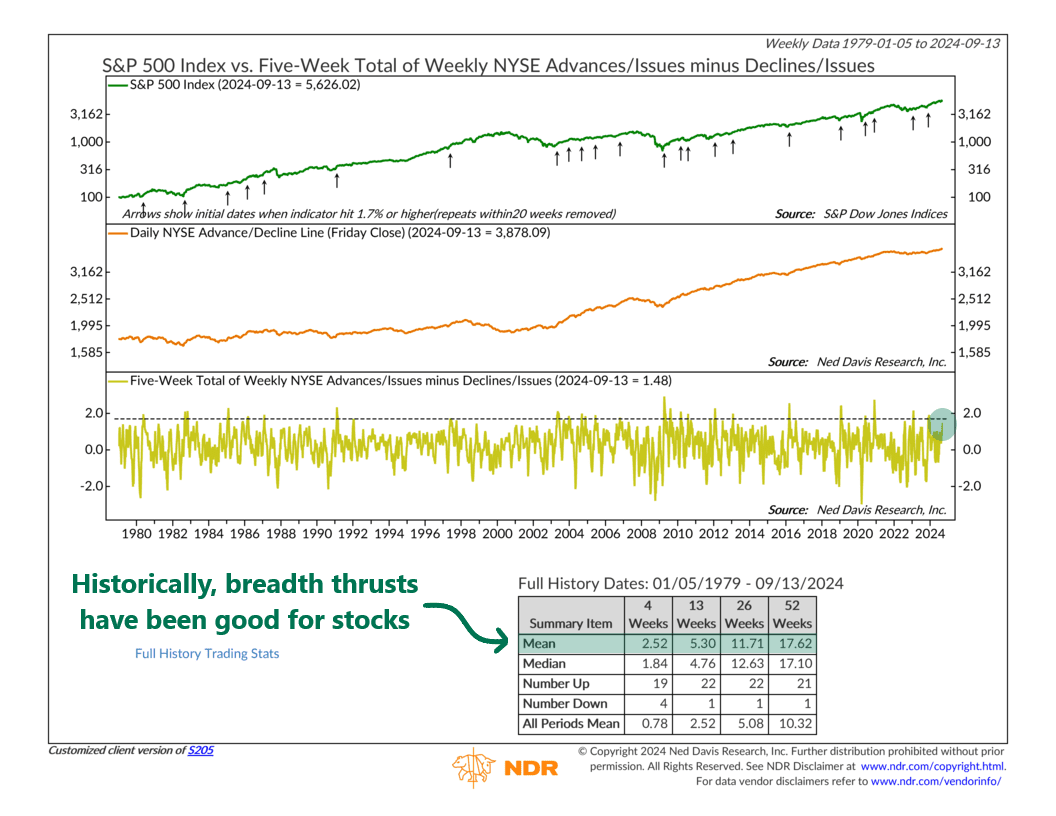
Sometimes price isn’t the only thing that matters to investors. Breadth—the number of stocks going up or down—can be a valuable tool, too.
For example, a popular way to measure this is with the Advance/Decline (A/D) Line. It’s calculated by taking the number of stocks that rose, subtracting those that fell, and dividing by the total number traded that day. This number gets added to a running total, which you can see as the orange line in the middle of the chart above.
But there’s more to it. The A/D Line can also give us a “breadth thrust” signal. In the bottom part of the chart (gold line), there’s a weekly version of the A/D Line, averaged over five weeks. When this line rises above 1.7, it signals a “breadth thrust,” which means many stocks are rising together. Historically, this has led to big gains for the S&P 500 over the next year.
Indeed, looking at past signals, the market has gone up 19 out of 23 times after a breadth thrust, with an average gain of 17.6% over the following year. The last signal came in December 2023, and since then, the S&P 500 has climbed about 24%.
Will we get another signal soon? Last week, the 5-week A/D Line hit 1.48, so it’s close. If it goes above 1.7 in the coming weeks, that would likely be a positive sign for the market.
However, if we don’t get a new signal soon, the bullish momentum from last December’s signal will expire by this December. At that point, the market may need a new source of strength to keep the rally going.
This is intended for informational purposes only and should not be used as the primary basis for an investment decision. Consult an advisor for your personal situation.
Indices mentioned are unmanaged, do not incur fees, and cannot be invested into directly.
Past performance does not guarantee future results.
