This week, attention was on the East Coast dockworkers’ strike, which threatened to disrupt supply chains and push inflation higher. Fortunately, a deal was made on Thursday, avoiding what could have been a major issue.
I bring this up because this event served as a reminder of how fragile global supply chains can be and why it’s important to keep an eye on them.
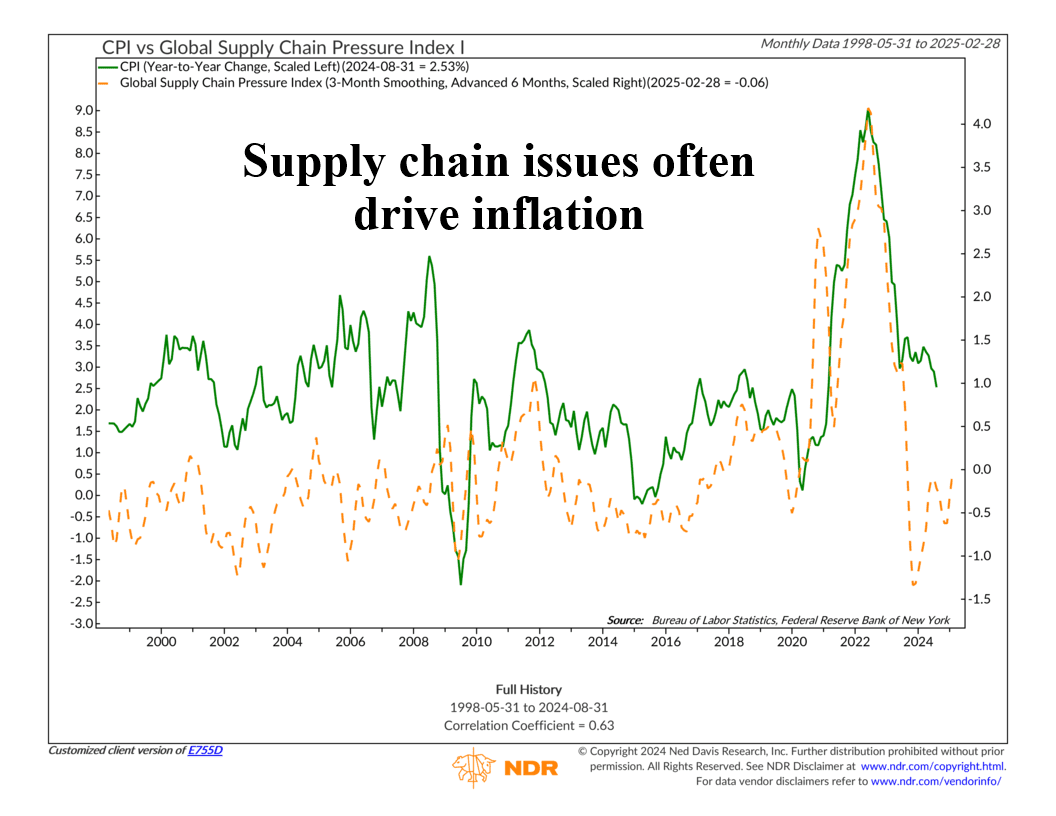
This week’s featured chart shows the Global Supply Chain Pressure Index (orange dashed line, averaged over 3 months) alongside the year-over-year change in the Consumer Price Index (green line). The Supply Chain Index is shown 6 months ahead because it often predicts inflation trends. The key takeaway is that when supply chain pressures rise, inflation usually follows.
The chart shows how the Supply Chain Index spiked during the pandemic, which drove inflation higher. Since then, the index has dropped, helping to bring inflation down. Earlier this year, it even went negative but has recently leveled off.
It would be a good idea to keep an eye on this relationship going forward, especially with potential disruptions like labor strikes. While this immediate crisis was resolved, the recent rise in supply chain pressures suggests there are still risks ahead. Tracking this will help give a clearer picture of where inflation is going in the coming months.
This is intended for informational purposes only and should not be used as the primary basis for an investment decision. Consult an advisor for your personal situation.
Indices mentioned are unmanaged, do not incur fees, and cannot be invested into directly.
Past performance does not guarantee future results.