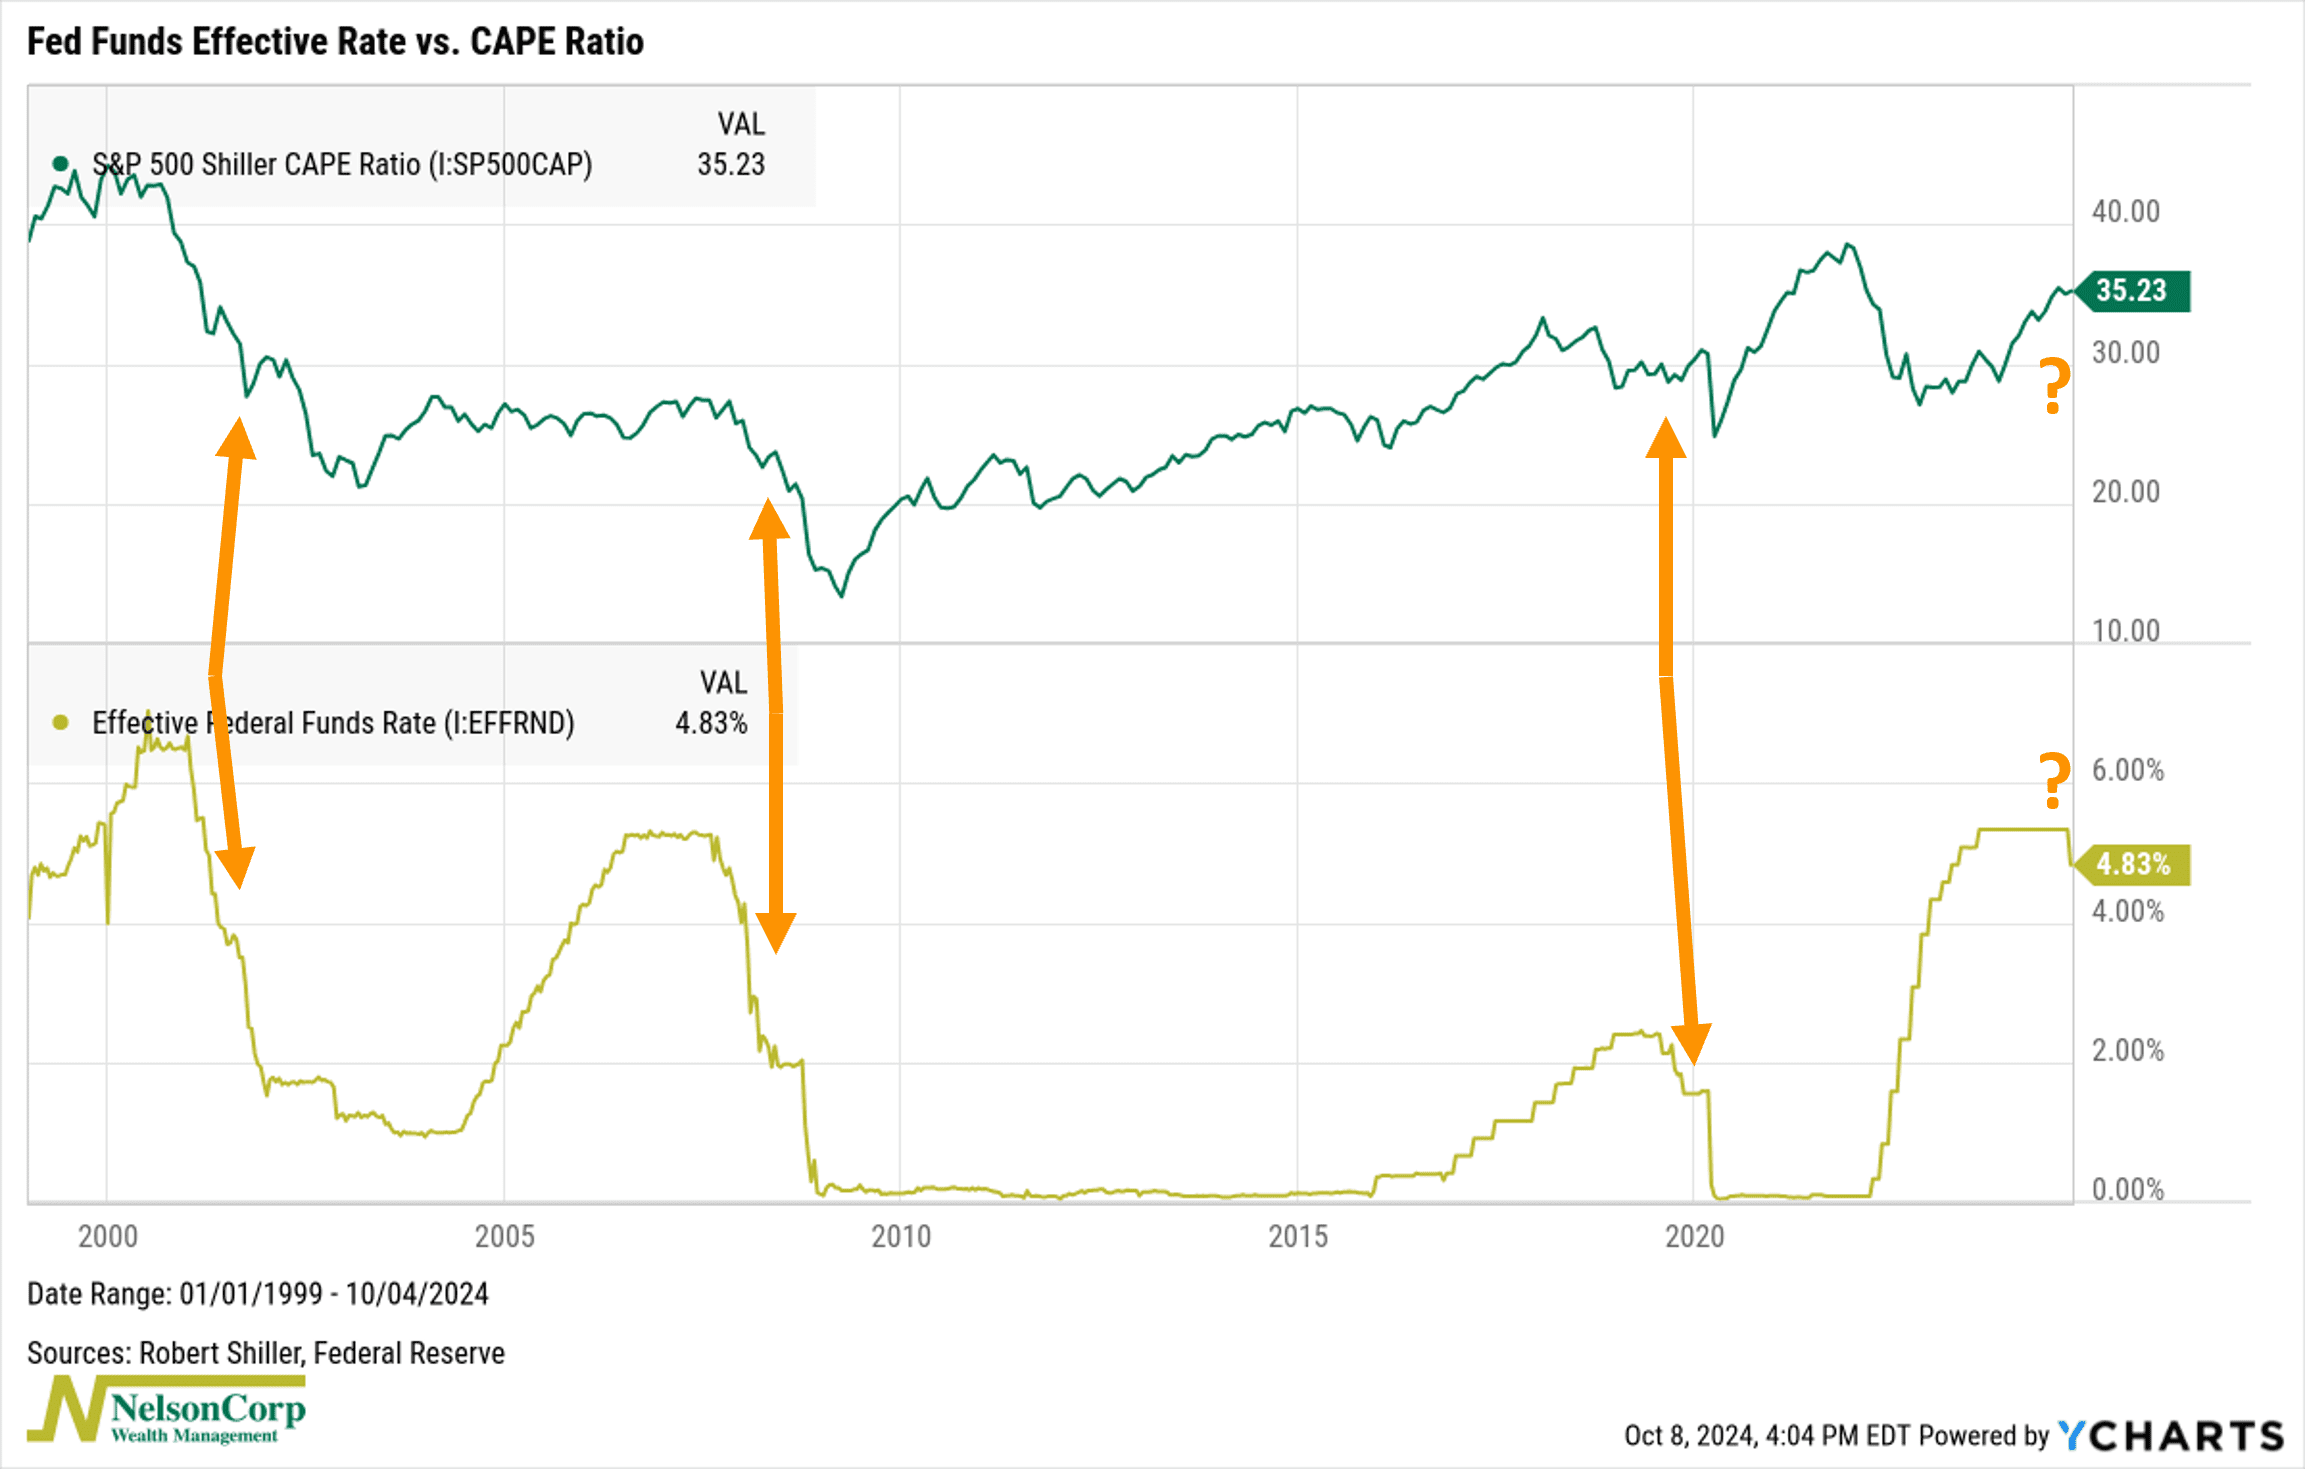
This week’s chart highlights a key connection between the Fed Funds Rate and stock market valuations, as measured by the CAPE ratio.
But first, some definitions. The Fed Funds Rate is controlled by the Federal Reserve and influences all other interest rates. The CAPE ratio, or Cyclically Adjusted Price-to-Earnings ratio, tells us how expensive or cheap the stock market is by looking at average company earnings over the past 10 years, adjusted for inflation.
The chart shows how these two measures have moved together since 2000. The main insight is that when the Fed cuts rates, the CAPE ratio often falls, which signals more attractive valuations in the market.
Whether a falling CAPE is good or bad depends on the reason. If it’s dropping because earnings are rising faster than stock prices, it’s a positive sign—stocks are becoming more reasonably priced. But if the CAPE is falling due to a drop in prices, that’s obviously not too good.
So, the key takeaway from this chart is that if the Fed continues to cut rates, we’ll likely see stock valuations become more attractive, one way or another.
This is intended for informational purposes only and should not be used as the primary basis for an investment decision. Consult an advisor for your personal situation.
Indices mentioned are unmanaged, do not incur fees, and cannot be invested into directly.
Past performance does not guarantee future results.