OVERVIEW
U.S. stocks were in the green last week, with the S&P 500 rising 1.11%, the Dow gaining 1.21%, and the Nasdaq up 1.13%. Small-cap stocks brought up the rear, rising just 0.33%.
Foreign markets were mixed. Developed countries saw gains of around 0.25%, whereas emerging markets dipped 1.68%. The U.S. dollar strengthened about 0.6% against the world’s major currencies.
Bonds struggled as the yield on the benchmark 10-year Treasury rose to 4.11% from 3.96% the week before. While short-term Treasuries saw moderate gains of 0.09%, longer-dated Treasuries fell about 0.5% to 1.9%.
Real estate also struggled, dipping 0.35% for the week. Commodities also fell about 1.25%. While oil increased 1.5%, agricultural prices dropped, with corn falling over 2%.
KEY CONSIDERATIONS
Follow Trendlines, not Headlines – When it comes to investing, the daily news cycle can be a bit overwhelming. Quite frankly, it’s a huge distraction. The urgency of headlines can make you feel like you need to act fast.
But you don’t. The optimal strategy, over the long term, is to follow the trendlines.
What are trendlines? It’s the general direction in which the market is moving over time. If prices are consistently going up, it’s an uptrend. If they’re going down, it’s a downtrend. And if prices aren’t moving much in either direction, it’s a sideways trend.
For example, here’s one way to measure the trend. The indicator below is what we call a Moving Average Slope indicator. It calculates the S&P 500’s trend over the past half year of trading (126 days) and looks at the slope of the moving average to determine if the market is trending up or down.
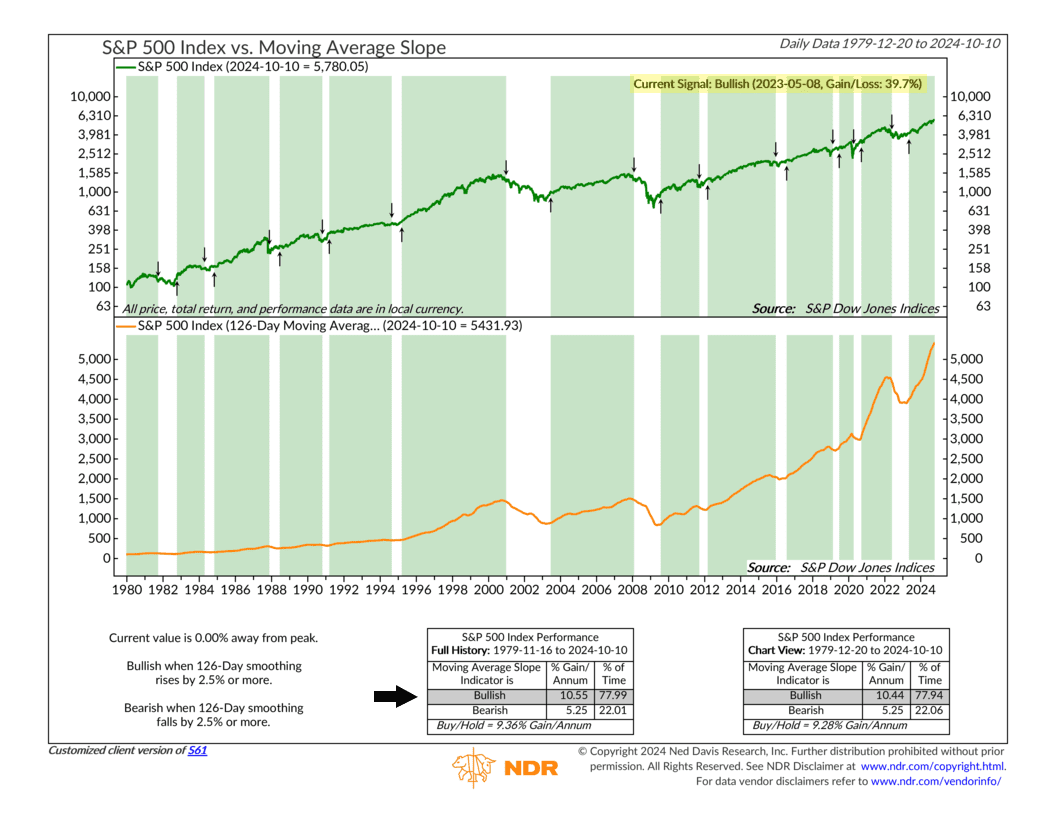
As you can see, a large chunk of the S&P 500’s gains have historically come when this indicator is in a bullish state. And here’s the good news: since May 2023, it’s been signaling a bullish trend, and the market has gained nearly 40% during that time.
Now, we’re not saying all news is bad or that you should ignore market headlines. But the data shows that paying attention to things like the market’s trend, momentum, and even sentiment is a robust investing strategy that tends to work more optimally over the long term.
So, with that said, I’ll end this week’s commentary with one last chart showing the state of the market’s overall trend. It’s a model that combines six different trend indicators into one metric, telling us how strong the market’s trend is. When the model is 100% bullish, it means all six indicators are pointing up.
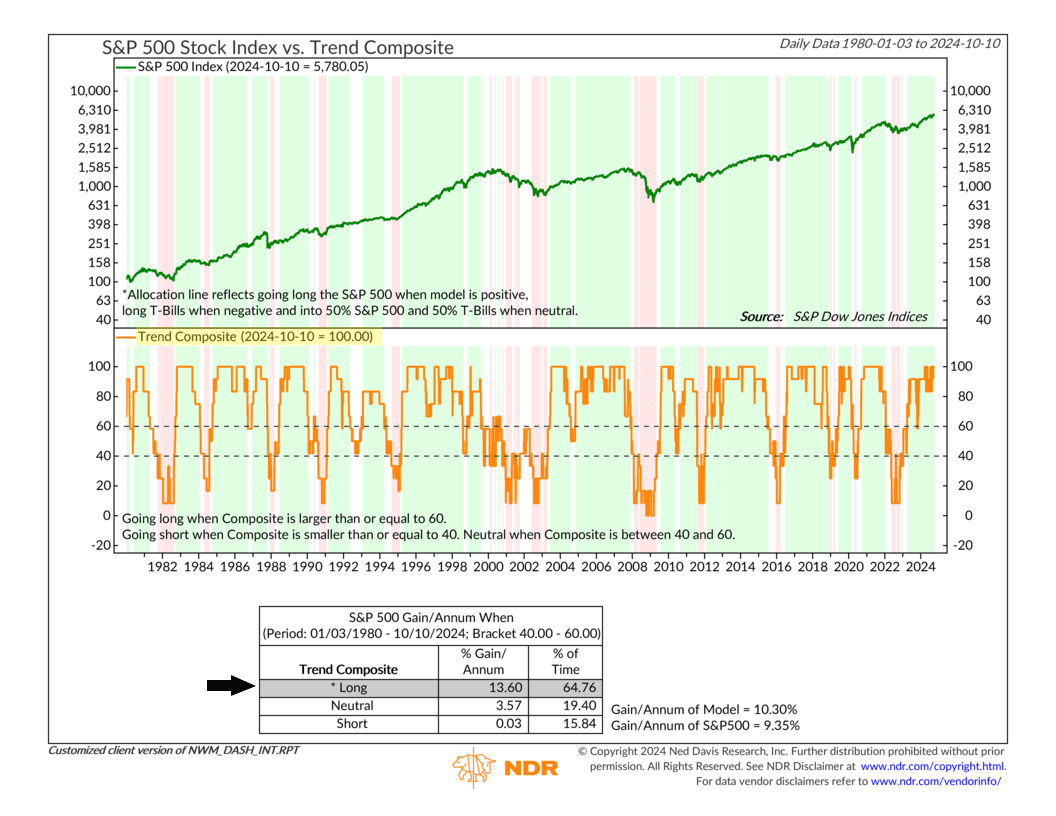
And as you can see, it’s 100% bullish. Not bad.
This is intended for informational purposes only and should not be used as the primary basis for an investment decision. Consult an advisor for your personal situation.
Indices mentioned are unmanaged, do not incur fees, and cannot be invested into directly.
Past performance does not guarantee future results.
The S&P 500 Index, or Standard & Poor’s 500 Index, is a market-capitalization-weighted index of 500 leading publicly traded companies in the U.S.