This week’s indicator is all about the cyclical sectors.
What are the cyclical sectors? Well, as their name implies, they’re sectors that are in sync with the economic cycle. When the economy grows, these sectors do well. But when the economy contracts, they face declines.
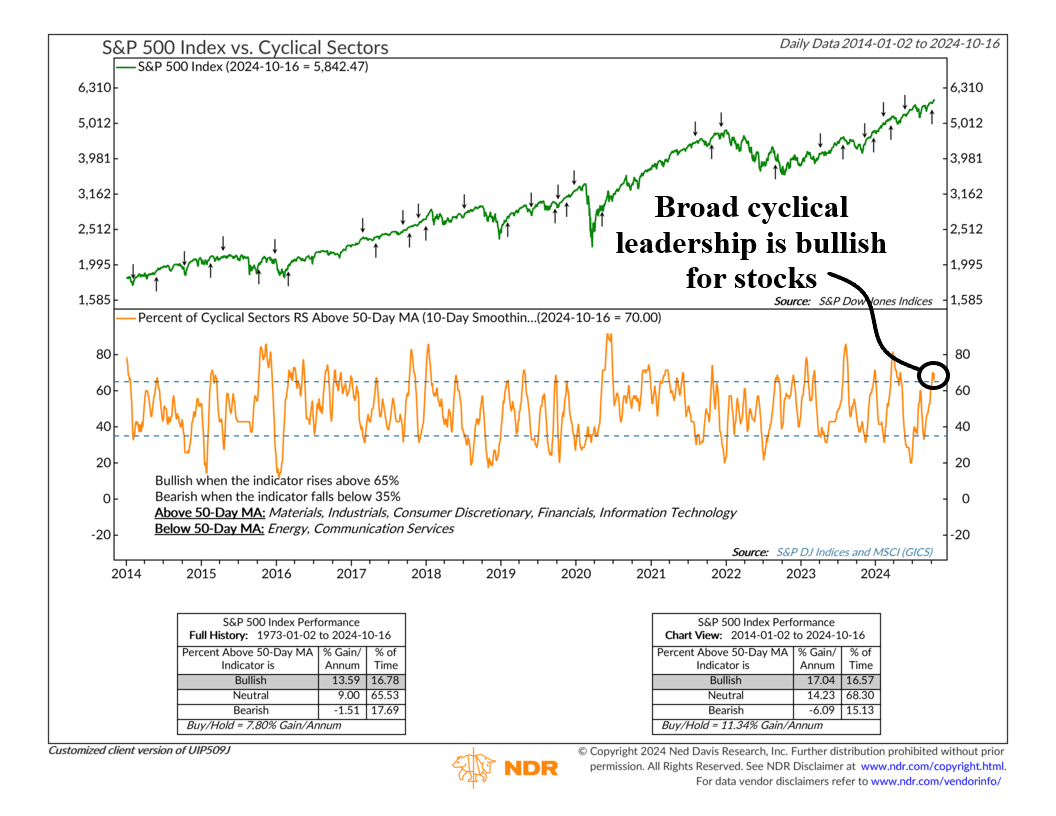
There are seven cyclical sectors in the S&P 500 Index: Materials, Industrials, Consumer Discretionary, Financials, Information Technology, Energy, and Communication Services. Historically, these are the sectors that have outperformed during economic expansion and underperformed during recessions or slowdowns.
Our indicator, shown as the orange line in the chart above, takes these seven cyclical sectors and compares each of their relative strength lines to their 50-day average price. Basically, this means it looks at each sector, determines how it’s performing to the overall markets (its relative strength), and then looks at how it’s performing relative to its recent trend (its 50-day moving average).
The key insight of the indicator is that when more than 65% of the sectors have a relative strength greater than their 50-day moving average (smoothed by ten days for volatility), the S&P 500 has done well historically. Since 1973, it’s risen at a 13.59% pace when this is the case. But, when the percentage of cyclical sectors outperforming drops to less than 35%, S&P 500 returns actually turn negative, on average.
So, what’s the message now? Well, that’s the good news. Market leadership has been more cyclical since the beginning of September, with all sectors other than Energy and Communication Services now trading above their relative 50-day averages. That’s the most since May!
This is an important development for the ongoing success of the current bull market. As this indicator makes clear, historically, broad cyclical leadership has been bullish for stocks.
This is intended for informational purposes only and should not be used as the primary basis for an investment decision. Consult an advisor for your personal situation.
Indices mentioned are unmanaged, do not incur fees, and cannot be invested into directly.
Past performance does not guarantee future results.
The S&P 500 Index, or Standard & Poor’s 500 Index, is a market-capitalization-weighted index of 500 leading publicly traded companies in the U.S.