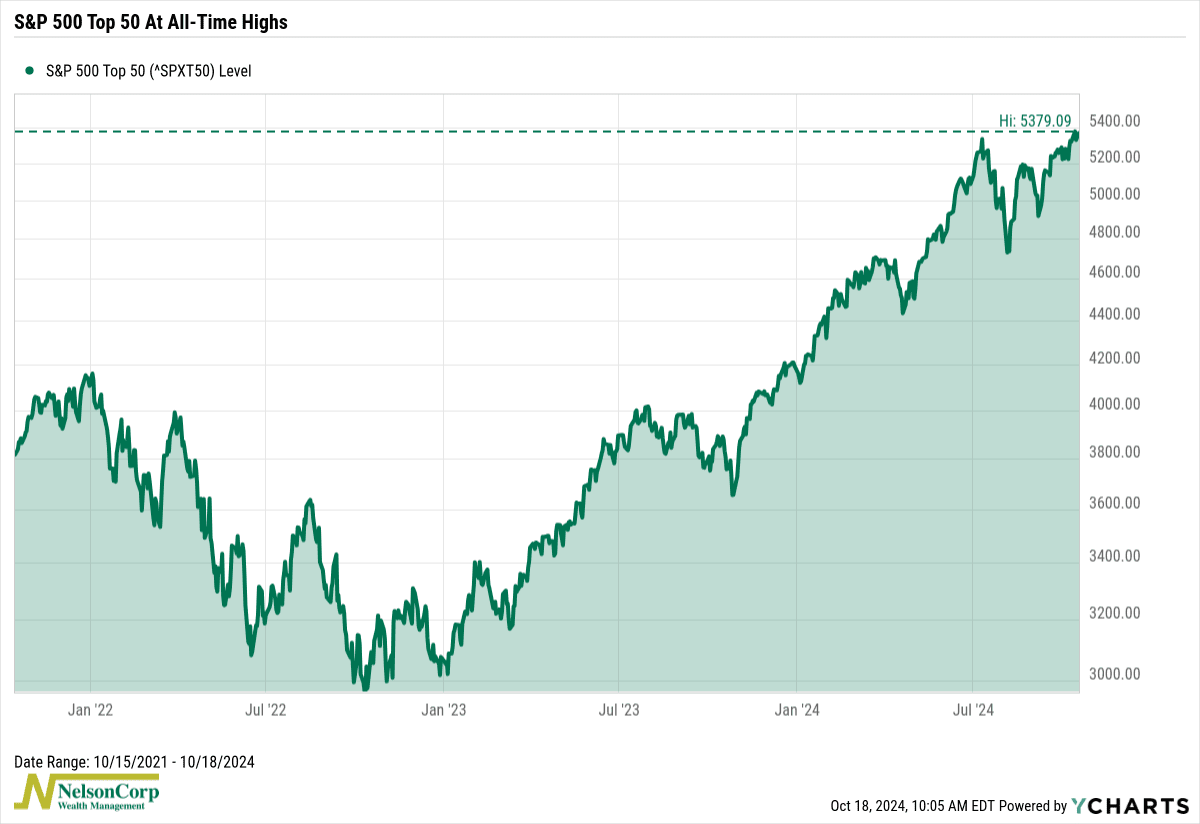
This week’s chart shows that the biggest and best of the stock market are breaking out to all-time highs.
The index, shown above, is the S&P 500 Top 50 Index. It’s a subset of the broader S&P 500 Index, focusing on the 50 largest companies by market capitalization within the S&P 500. These are typically blue-chip companies, known for their stability, strong financial performance, and dominance in their respective industries.
It basically serves as a barometer for how the “mega-caps” are performing relative to the broader market. And as you can see, they’re thriving.
As Bob Dylan once said, “You don’t need a weatherman to know which way the wind blows.” The same holds true for the stock market. Sometimes, the simplest approach is to just follow the lead of the biggest and best.
This is intended for informational purposes only and should not be used as the primary basis for an investment decision. Consult an advisor for your personal situation.
Indices mentioned are unmanaged, do not incur fees, and cannot be invested into directly.
Past performance does not guarantee future results.
The S&P 500 Top 50 consists of 50 of the largest companies from the S&P 500, reflecting U.S. mega-cap performance. Index constituents are weighted by float-adjusted market capitalization.