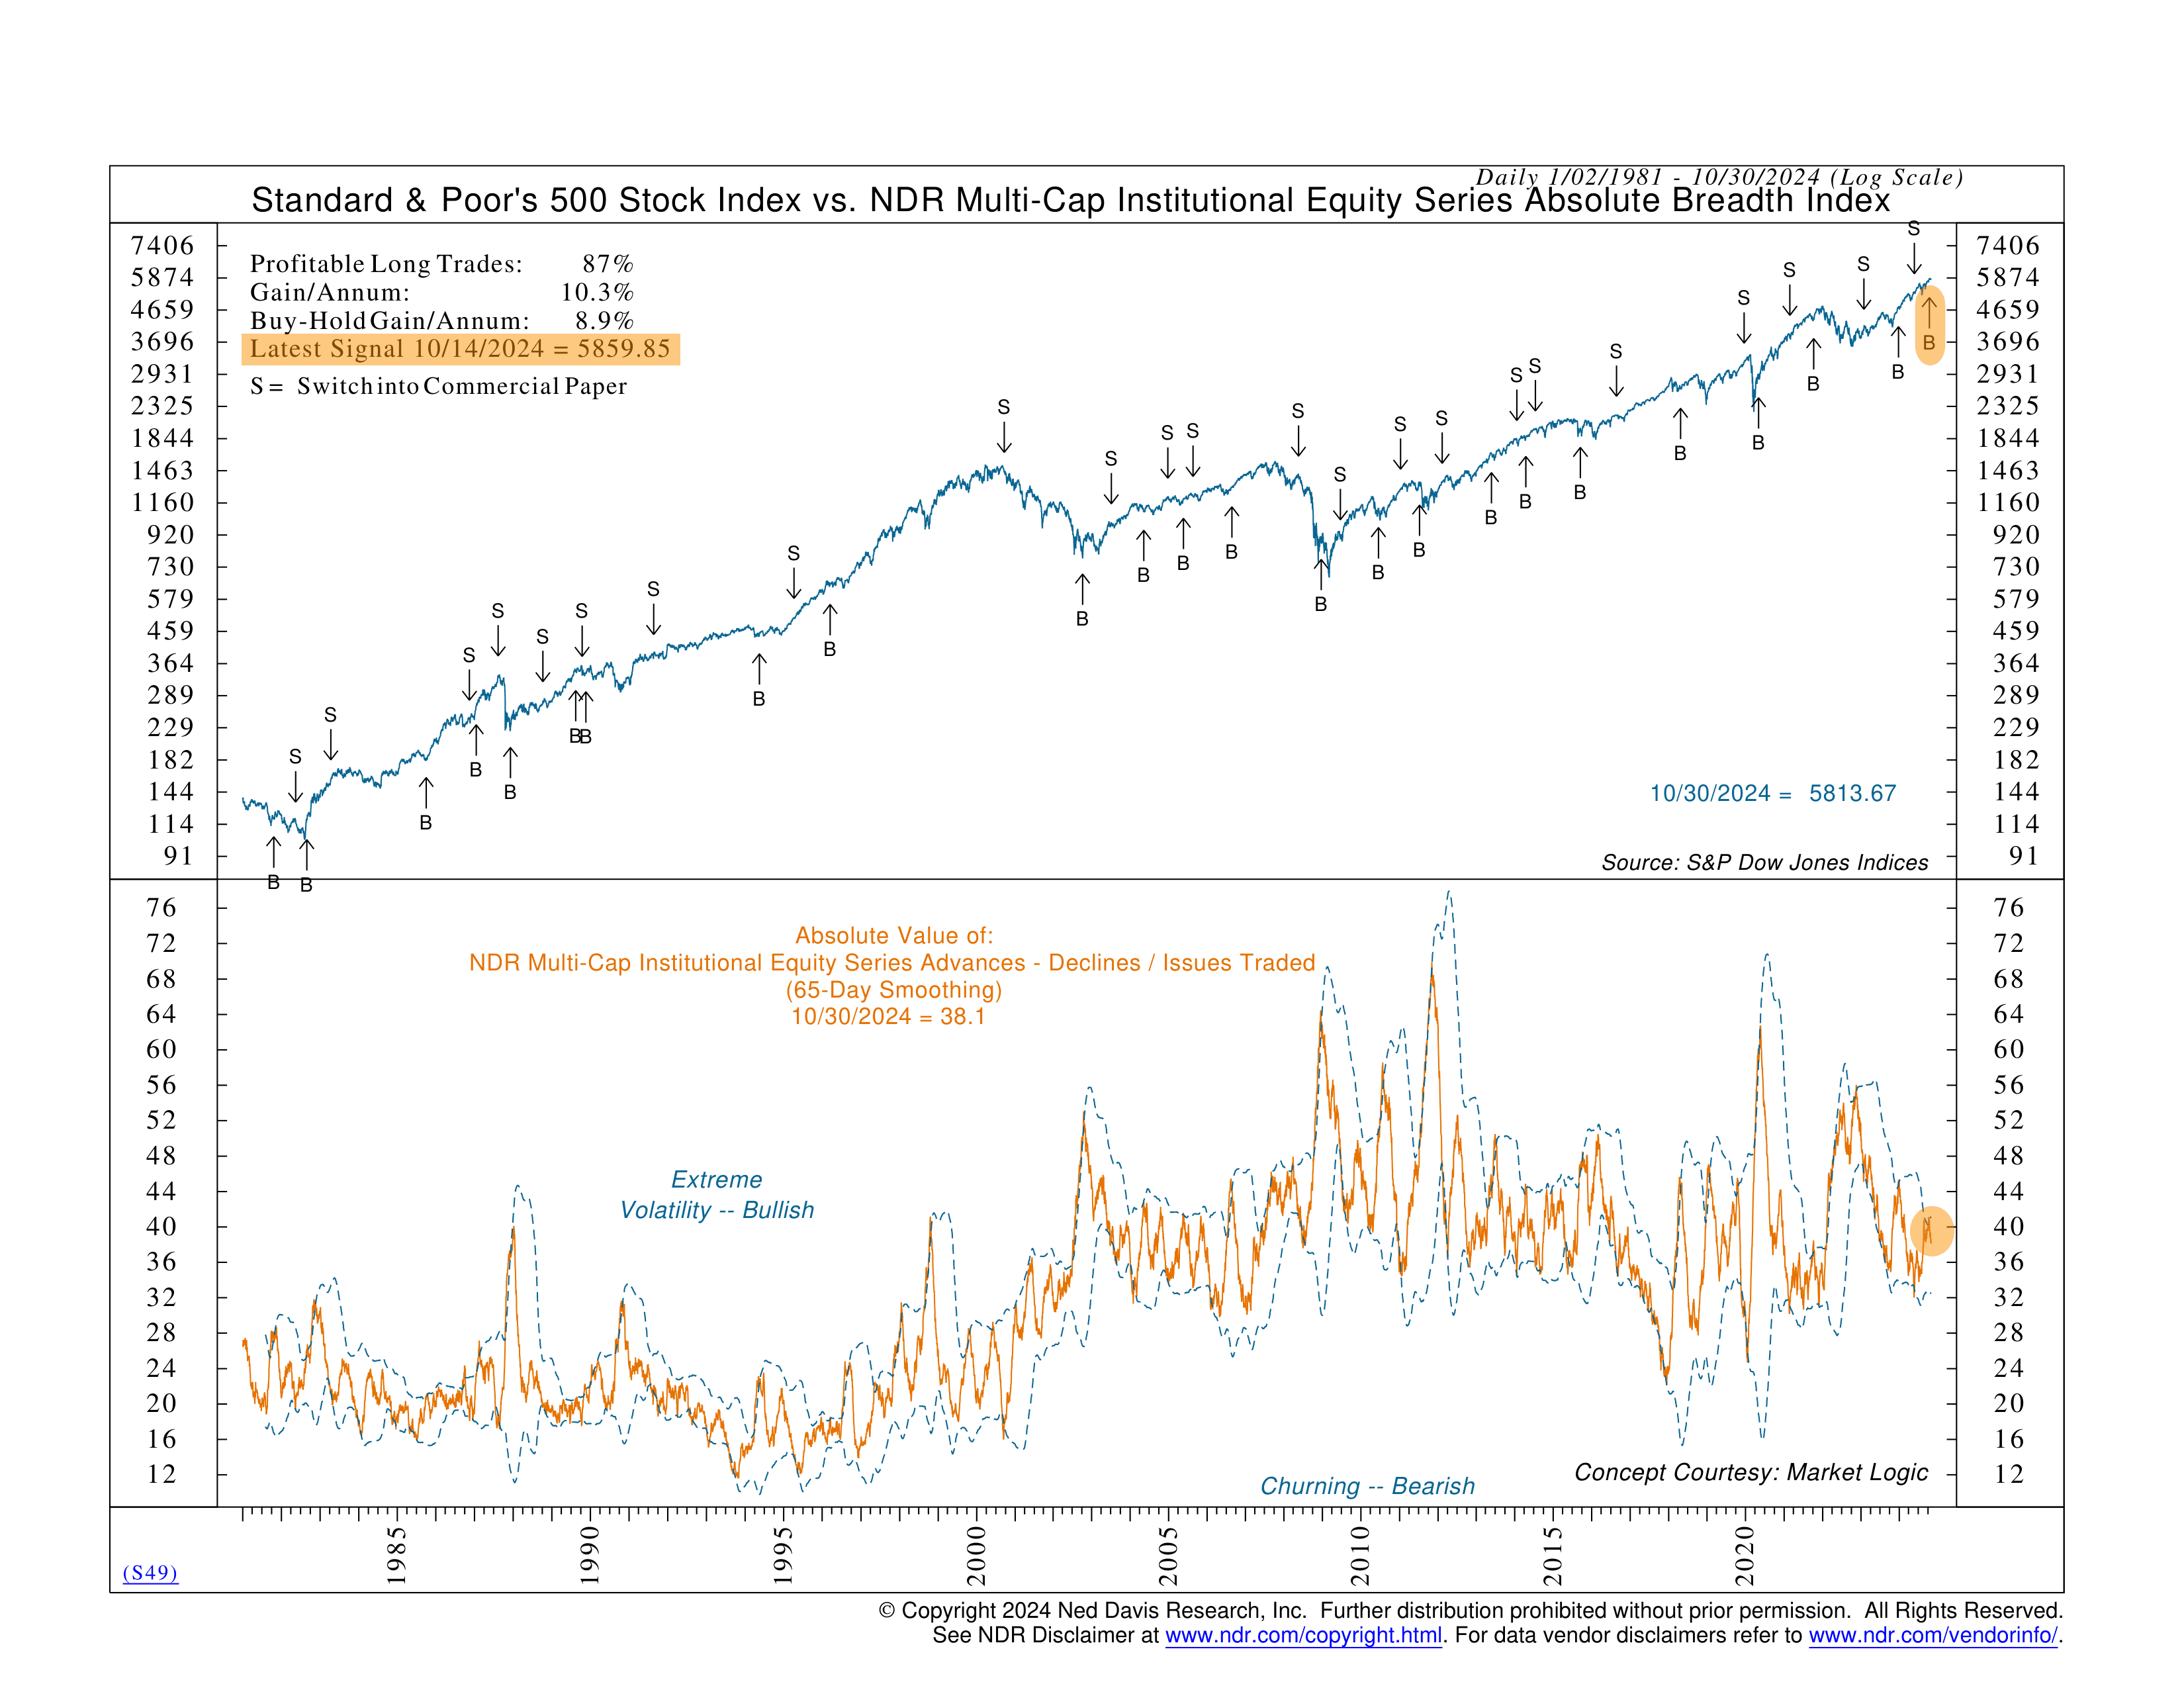
This week’s featured indicator highlights a neat tool called the Absolute Breadth Index, which measures volatility, or how much prices are bouncing around.
But the Absolute Breadth Index stands out because it doesn’t care about direction—whether prices are rising or falling. All it tracks is the action itself. It does this by calculating the absolute difference between the number of stocks that went up and those that went down each week.
For example, if 10 stocks rose and 90 fell last week, we get a difference of -80. But the absolute value ignores the negative, making it a positive 80. Flip the situation to 90 up and 10 down, and it’s still 80. It’s the size of the move that matters, not the direction.
Since the number of stocks trading changes over time, we standardize the reading by dividing by the total stocks traded that week. In our example, 80 divided by 100 gives us 80%—a high volatility level. Historically, this signals a bullish setup, meaning a rally could be on the horizon as sellers have likely hit their breaking point.
In contrast, lower percentages, like 20%, signal a quiet market where everyone’s a bit too comfortable. Historically, this has aligned with market tops and underwhelming returns.
The good news? This indicator recently flashed a buy signal when its 65-day moving average broke through the upper standard deviation band. Simply put, rising stocks far outnumbered declining ones, a bullish sign suggesting many stocks are in uptrends.
How bullish? Well, historically, following this indicator’s signals would have boosted annual gains to around 10.3%, compared to the usual 8.9% from a buy-and-hold strategy. Even better, 87% of the trades would have been winners.
So, the bottom line is that the Absolute Breadth Index is a great tool for gauging market participation. By blending breadth and volatility, it offers insights into where the market might be headed next.
This is intended for informational purposes only and should not be used as the primary basis for an investment decision. Consult an advisor for your personal situation.
Indices mentioned are unmanaged, do not incur fees, and cannot be invested into directly.
Past performance does not guarantee future results.
The S&P 500 Index, or Standard & Poor’s 500 Index, is a market-capitalization-weighted index of 500 leading publicly traded companies in the U.S.
