OVERVIEW
It was a positive week for U.S. stocks. The S&P 500 gained 1.68%, the Dow increased 1.96%, and the Nasdaq rose 1.73%. Small caps outperformed, surging 3.72%.
Foreign stocks, on the other hand, were mixed. While emerging markets saw gains of 0.21%, developed markets fell about 0.05%. The U.S. dollar strengthened around 0.8%.
Bonds rose as the yield on the benchmark 10-year Treasury yield rose to 4.41%. Overall, the core U.S. bond market rose about 0.15%.
Commodities had a good week, increasing about 3% broadly. Oil surged 6.5%, and gold increased around 5.5%. Real estate also rose about 2.6% for the week.
KEY CONSIDERATIONS
A Tale of Three Trend – The stock market regained its footing last week. Three key trends are partially responsible.
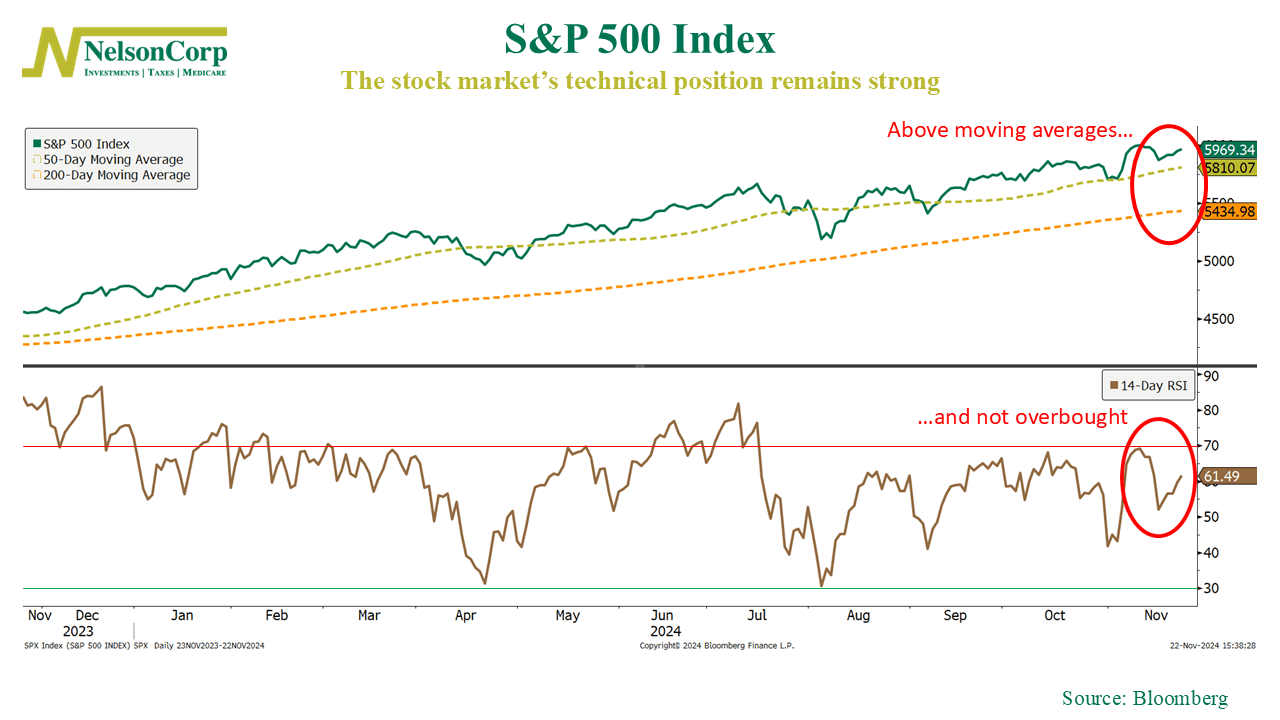
For example, let’s look at the technicals. As the chart below shows, the S&P 500 remains comfortably above its 50-day and 200-day moving averages, signaling a healthy market uptrend.

But is the market in danger of getting overbought? The answer, according to the Relative Strength Index (RSI) at the bottom of the chart, is no. It sits at a healthy 61, a sign that we’re in no danger of overbought conditions—yet.
Overall, this paints a picture of the market climbing steadily, like runners pacing themselves for a marathon. A strong technical foundation like this often translates to sustained gains in the months ahead.
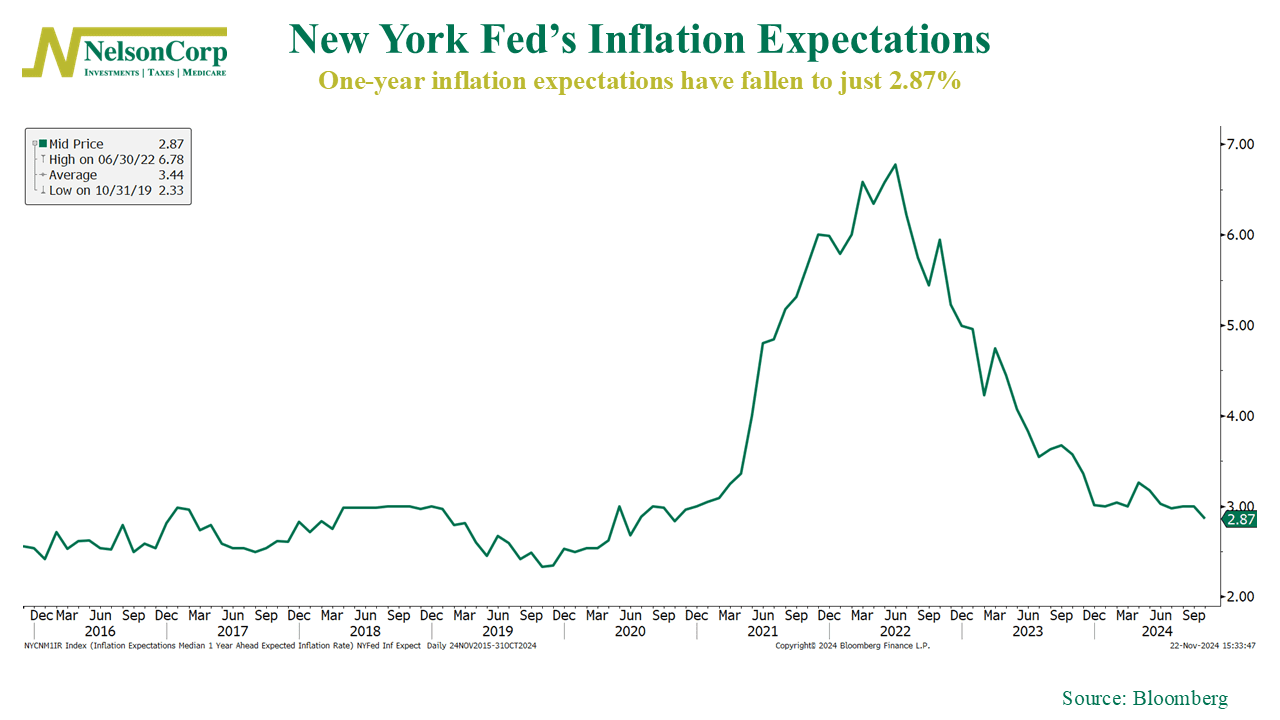
Then there’s inflation. It’s no secret that inflation can wreak havoc on both wallets and markets, but the outlook is improving. The New York Fed’s one-year inflation survey (see chart) shows consumers dialing back their inflation outlook to a modest 2.87%, a stark contrast to the high levels seen in mid-2022.

It’s encouraging to see this data flip from peak fear to relative calm. Lower inflation expectations will make the Fed’s job easier, giving them more leeway to keep rates stable going forward.
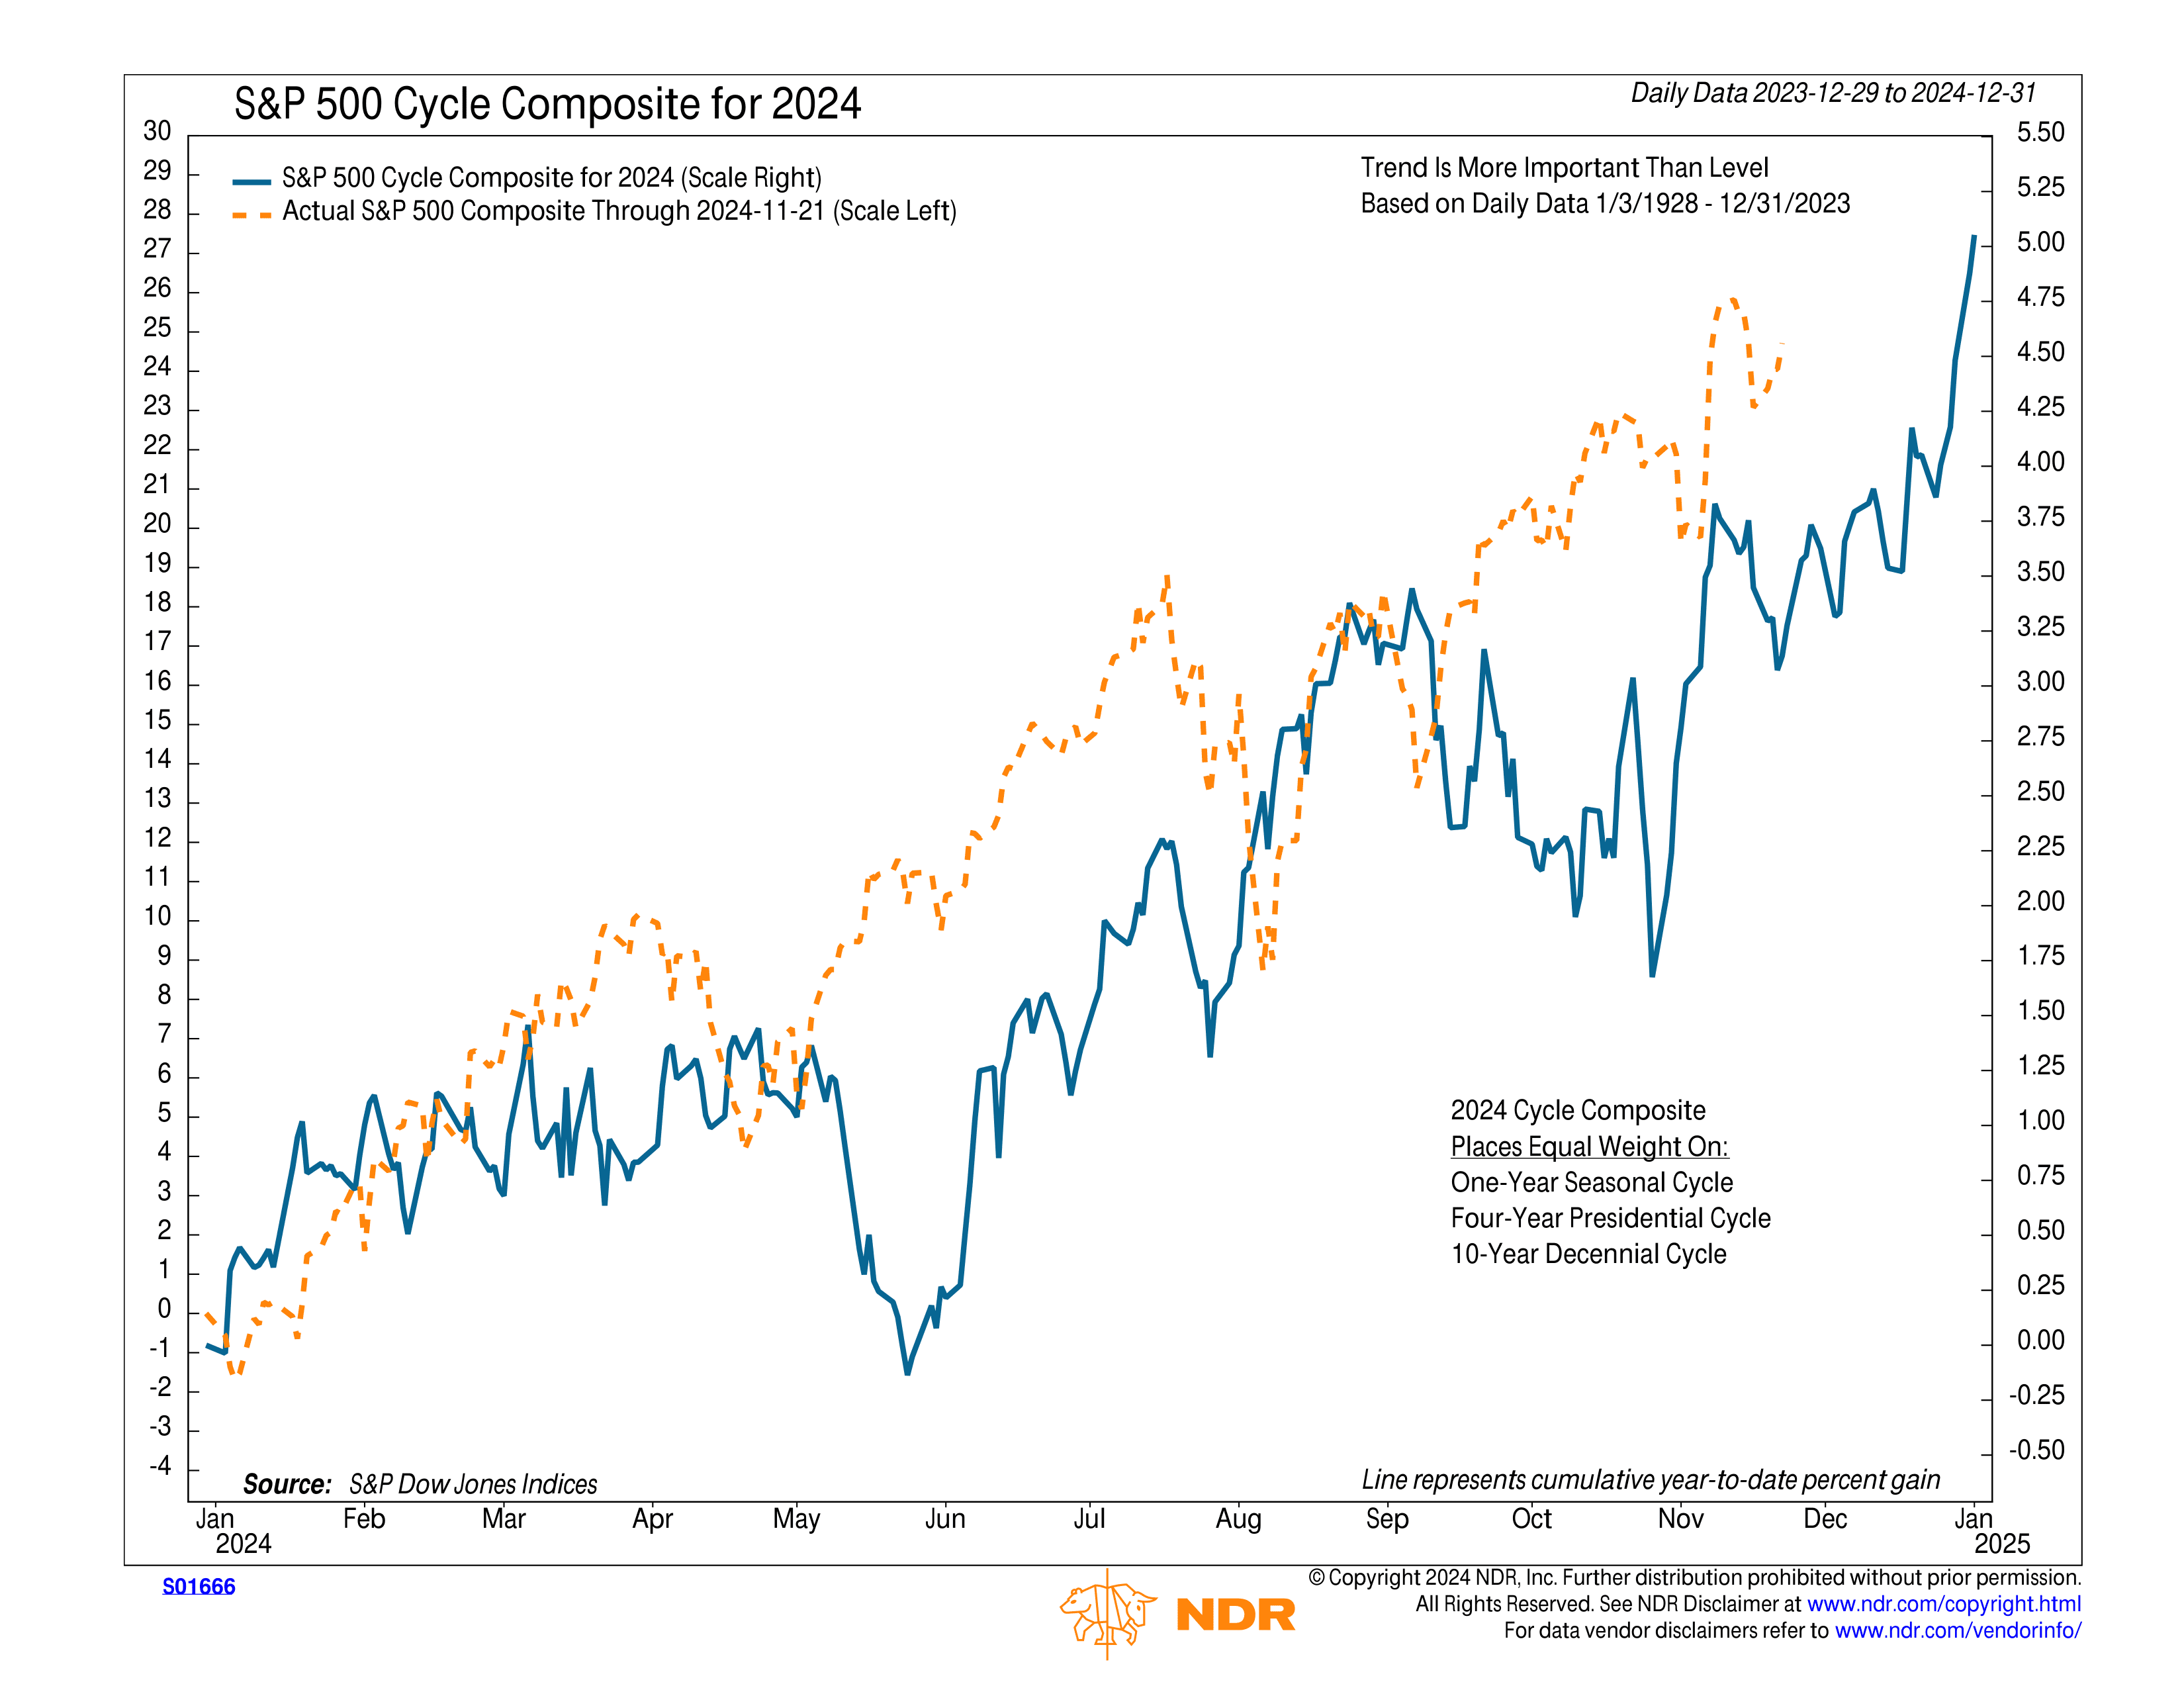
Finally, let’s talk cycles. The S&P 500 Cycle Composite for 2024 (shown below) blends the one-year seasonal cycle, four-year presidential cycle, and 10-year decennial cycle into one fascinating roadmap.

So far, the market has tracked the composite’s projection almost perfectly, which bodes well for the months ahead. If the pattern holds, we could see a strong finish to the year, with December shaping up to be the market’s grand finale—a Santa Claus rally to cap it all off.
In summary, strong technicals, easing inflation expectations, and favorable historical cycles all point to a market set up for continued strength. It’s a bullish outlook, and the market seems ready to keep climbing.
This is intended for informational purposes only and should not be used as the primary basis for an investment decision. Consult an advisor for your personal situation.
Indices mentioned are unmanaged, do not incur fees, and cannot be invested into directly.
Past performance does not guarantee future results.
The S&P 500 Index, or Standard & Poor’s 500 Index, is a market-capitalization-weighted index of 500 leading publicly traded companies in the U.S.
