This week’s indicator is the cornerstone of the current bull market in stocks. But first, I’ll explain what it does.
In essence, the indicator monitors shifts in interest rates to signal stock market trends. Specifically, it focuses on changes in the yield of the two-year Treasury note.
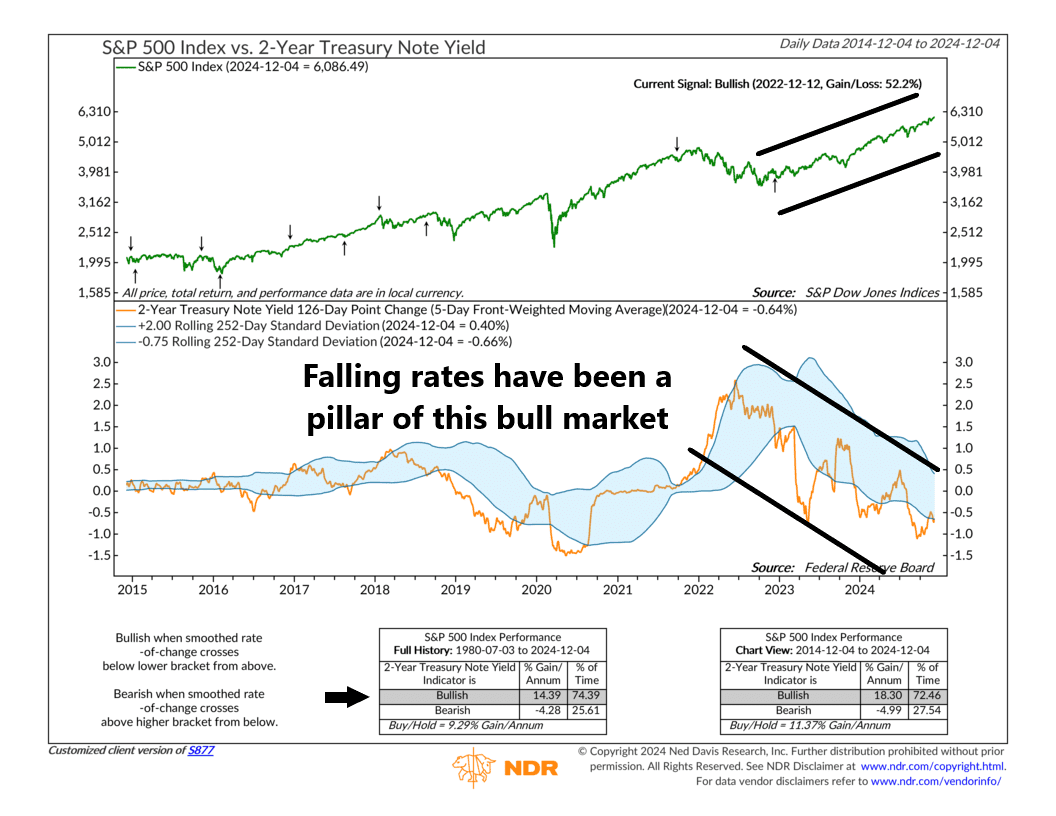
When the smoothed 126-day point change in the yield (orange line, bottom clip) drops well below its trend, it signals a bullish outlook for stocks. This reflects easier Fed policy and improved market liquidity. On the flip side, when the yield rises sharply above trend, the indicator flips bearish, signaling tighter Fed policy and potential headwinds for equities.
Take a look at the chart. Since mid-2022, the two-year yield’s steady decline has been a driving force behind the bull market. The upward arrow on the S&P 500 line marks the pivotal bullish crossover, where falling interest rates kicked off a powerful rally. Since that moment, the S&P 500 has surged over 50%.
Looking ahead, however, this indicator will be critical to watch. It could be among the first to signal the end of the Fed’s easing cycle. The two-year Treasury yield closely reflects where the Fed plans to steer rates. If it reverses course and starts climbing, it could signal trouble ahead for stocks.
For now, though, the two-year yield remains a solid foundation for this bull market. It continues to sustain optimism and support further gains. But stay tuned—this indicator may give us the first glimpse of changing tides if and when they happen.
This is intended for informational purposes only and should not be used as the primary basis for an investment decision. Consult an advisor for your personal situation.
Indices mentioned are unmanaged, do not incur fees, and cannot be invested into directly.
Past performance does not guarantee future results.
The S&P 500 Index, or Standard & Poor’s 500 Index, is a market-capitalization-weighted index of 500 leading publicly traded companies in the U.S.
