OVERVIEW
It was a mixed week on Wall Street last week. While the Nasdaq rose 0.34%, the S&P 500 fell 0.64% and the Dow slipped 1.82%. Overall, value stocks were down around 2% versus a 0.11% gain for growth stocks.
Foreign markets were mixed, too. Emerging markets rose 0.18% but developed country stocks declined by 1.5%. The U.S. dollar strengthened around 1.1%.
Bonds had a particularly rough week as the yield on the 10-year Treasury rose to 4.4% from 4.17% the week before. When it was all said and done, the core bond market was down around 1.4%.
Commodities, on the other hand, held up much better. Broadly, they rose about 1.22%, led by oil’s gain of about 5.7%. Gold rose 0.6%, and corn increased about 0.45%. However, real estate fell roughly 1.85%.
KEY CONSIDERATIONS
Downward Dow – The stock market has done really well this year. The past few months, in particular, have been relatively strong.
However, in recent days, the selling pressure has started to pick up— not dramatically, but enough to catch our attention.
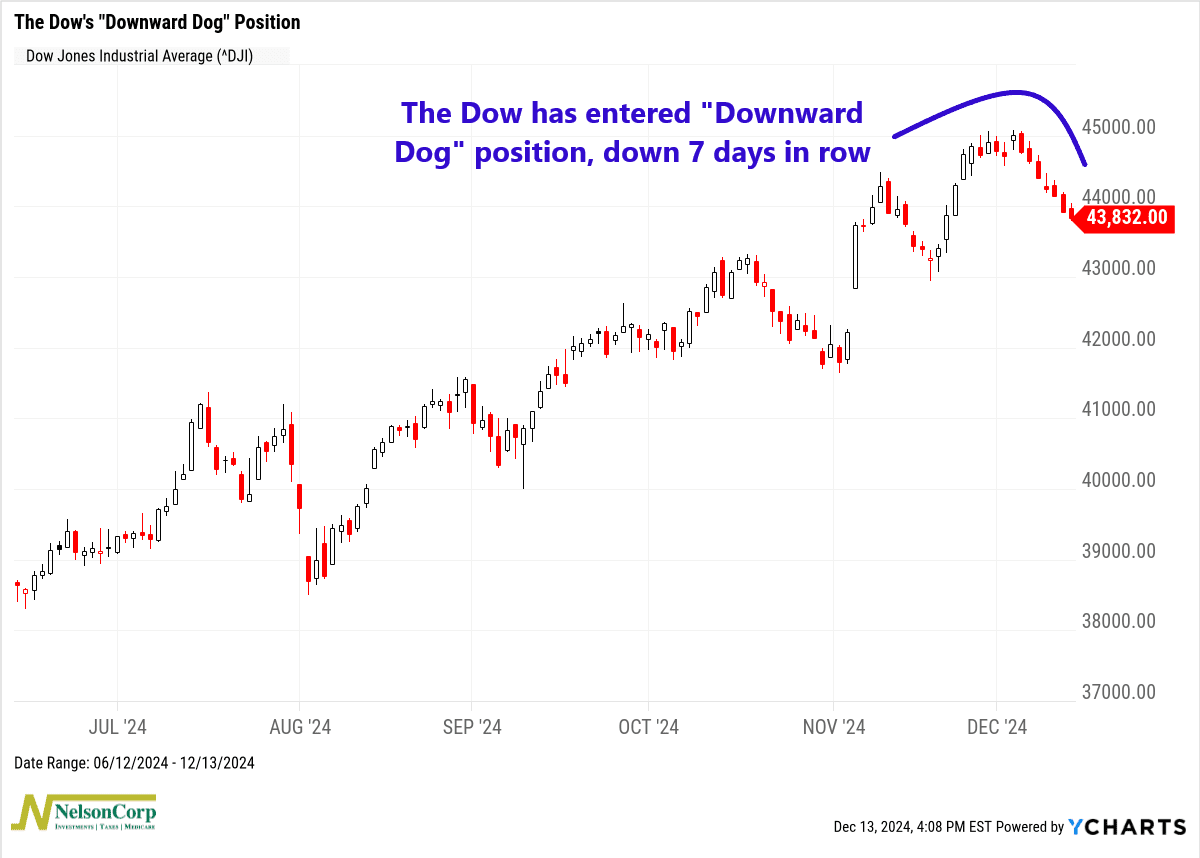
For example, my yoga people out there are probably familiar with the downward dog pose. For those unfamiliar, it looks a lot like an upside-down “V” shape, with your hands and feet on the ground, hips raised high, and your head hanging between your arms. It kind of looks like what the Dow Jones Industrial Average (the Dow) has been doing lately.

As you can see, the Dow has dripped lower for seven consecutive days, the first seven-day losing streak since the Covid crash of February 2020. That’s not a great look.
However, I will point out that this recent decline has been somewhat orderly. The total decline in the Dow has been a measly -2.63% over that seven-day streak. Plus, volume has been below average throughout the pullback, a sign that there really isn’t much panic happening among investors.
Still, the right time to consider bearish arguments is when things are going well. So, let’s consider some other weaknesses.
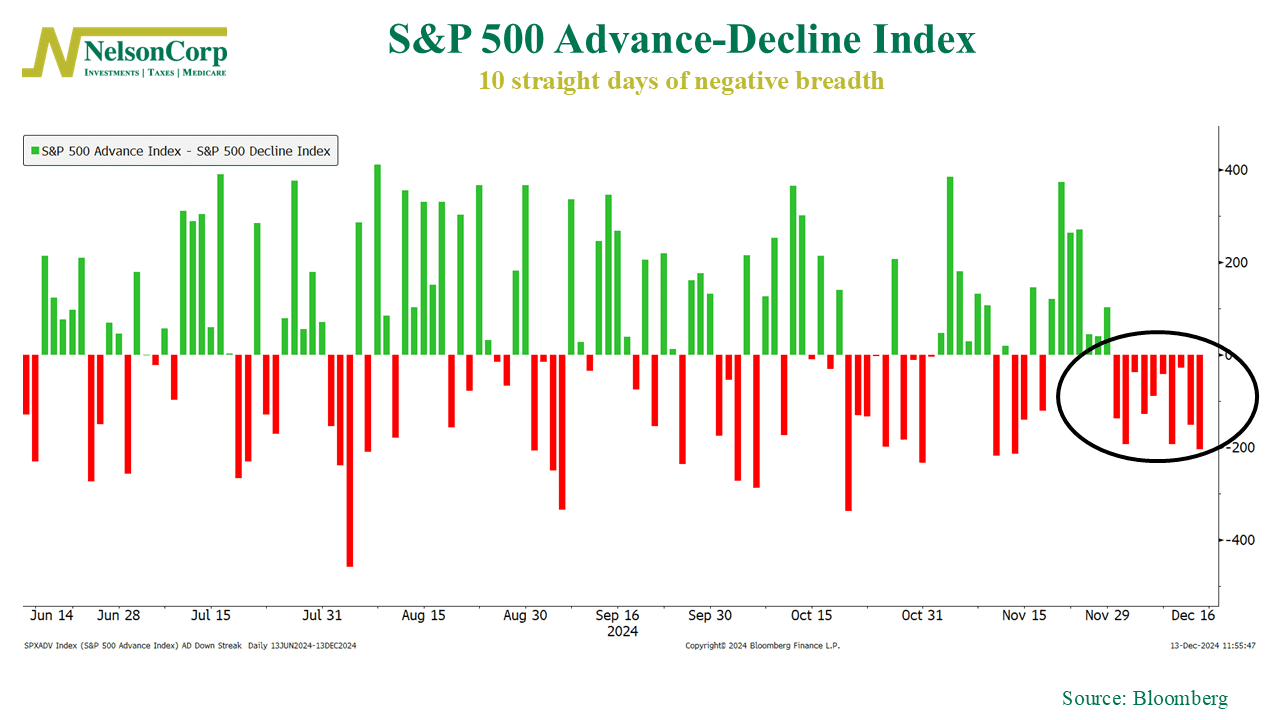
Here’s one. The S&P 500 Index just closed out its 10th day in a row where the number of underlying stocks within the index falling outnumbered those rising. In other words, we’ve had ten straight days of negative breadth in the stock market, shown below.

That’s the longest streak of negative breadth since Bloomberg started collecting data in 2004.
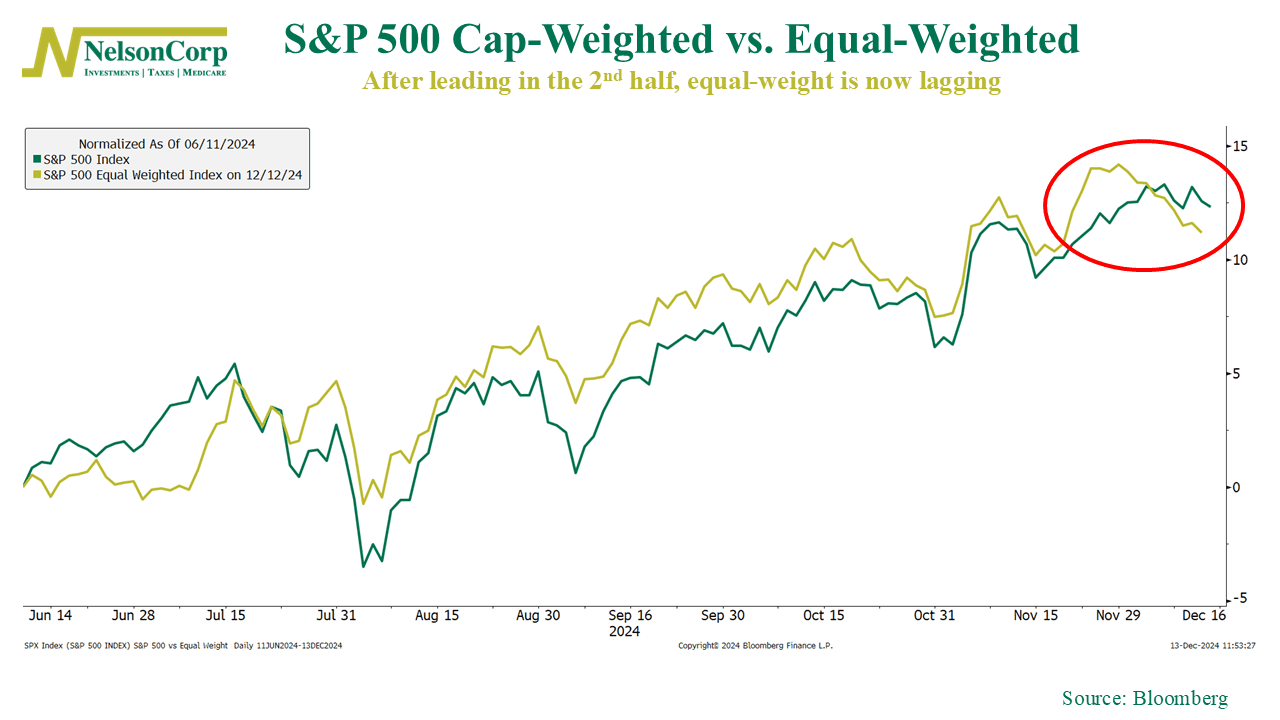
Another way of looking at this is to compare the standard market-cap-weighted version of the S&P 500 to its equal-weight counterpart. As you can see in this next chart, the equal-weight version (gold line) has been outpacing the regular version (green line) since the beginning of summer. But recently, the script flipped, with underlying breadth deteriorating.

In other words, market breadth has taken a turn for the worse and is on the verge of generating a sell signal.
Does this mean the market is absolutely doomed here? No, of course not. The weight of the broader evidence continues to lean bullish. However, we do think this negative breadth is something to keep an eye on, as it could eventually tip the scales if it continues to worsen.
This is intended for informational purposes only and should not be used as the primary basis for an investment decision. Consult an advisor for your personal situation.
Indices mentioned are unmanaged, do not incur fees, and cannot be invested into directly.
Past performance does not guarantee future results.
The S&P 500 Index, or Standard & Poor’s 500 Index, is a market-capitalization-weighted index of 500 leading publicly traded companies in the U.S.
