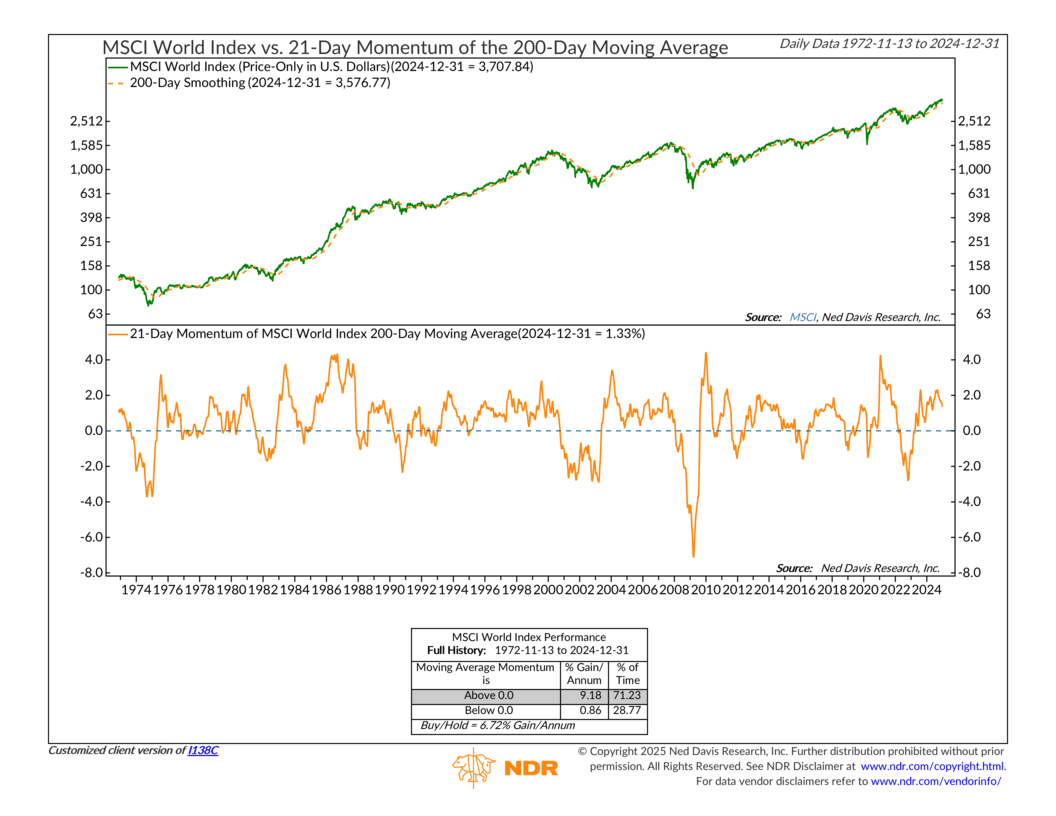
This week, we’re diving into a powerful chart: the MSCI World Index vs. the 21-Day Momentum of its 200-Day Moving Average. Don’t let the technical name intimidate you—this tool simply helps us stay in sync with the market’s long-term momentum.
The chart has two main parts. The top panel shows the MSCI World Index, which tracks global stock performance. Overlaid is a smoother, dotted orange line, the 200-day moving average. This represents the market’s long-term direction. The bottom panel features the 21-day momentum of this moving average, the solid orange line. Think of it as a speedometer for the long-term trend, showing whether it’s gaining or losing momentum.
Instead of getting caught up in the daily ups and downs, this indicator looks at how quickly the market’s longer-term trend is shifting. When the momentum line is above zero, it means the trend is strengthening. Below zero? The trend is running out of gas.
How’s the performance? Well, historically, when momentum has been positive, global stocks have delivered an annualized return of 9.18%. But when momentum dips into negative territory, returns have dropped to just 0.86%. That’s a huge difference—and a great reminder of why it’s so important to stay aligned with the big picture.
Currently, the momentum reading is at 1.33%, which is firmly in positive territory and above the long-run median reading of 0.8%. In other words, the long-term trend remains intact. However, I would note that momentum has started to wane recently. This shift has certainly caught our attention, particularly given the fact that returns have been so high of late. Nothing lasts forever, and while still favorable, the declining momentum is something we’ll be watching closely in the weeks ahead.
The bottom line? Markets can be noisy, but this indicator provides clarity. By focusing on long-term momentum, it helps sidestep emotional decisions and keeps us aligned with the market’s overarching direction.
This is intended for informational purposes only and should not be used as the primary basis for an investment decision. Consult an advisor for your personal situation.
Indices mentioned are unmanaged, do not incur fees, and cannot be invested into directly.
Past performance does not guarantee future results.
The S&P 500 Index, or Standard & Poor’s 500 Index, is a market-capitalization-weighted index of 500 leading publicly traded companies in the U.S.
