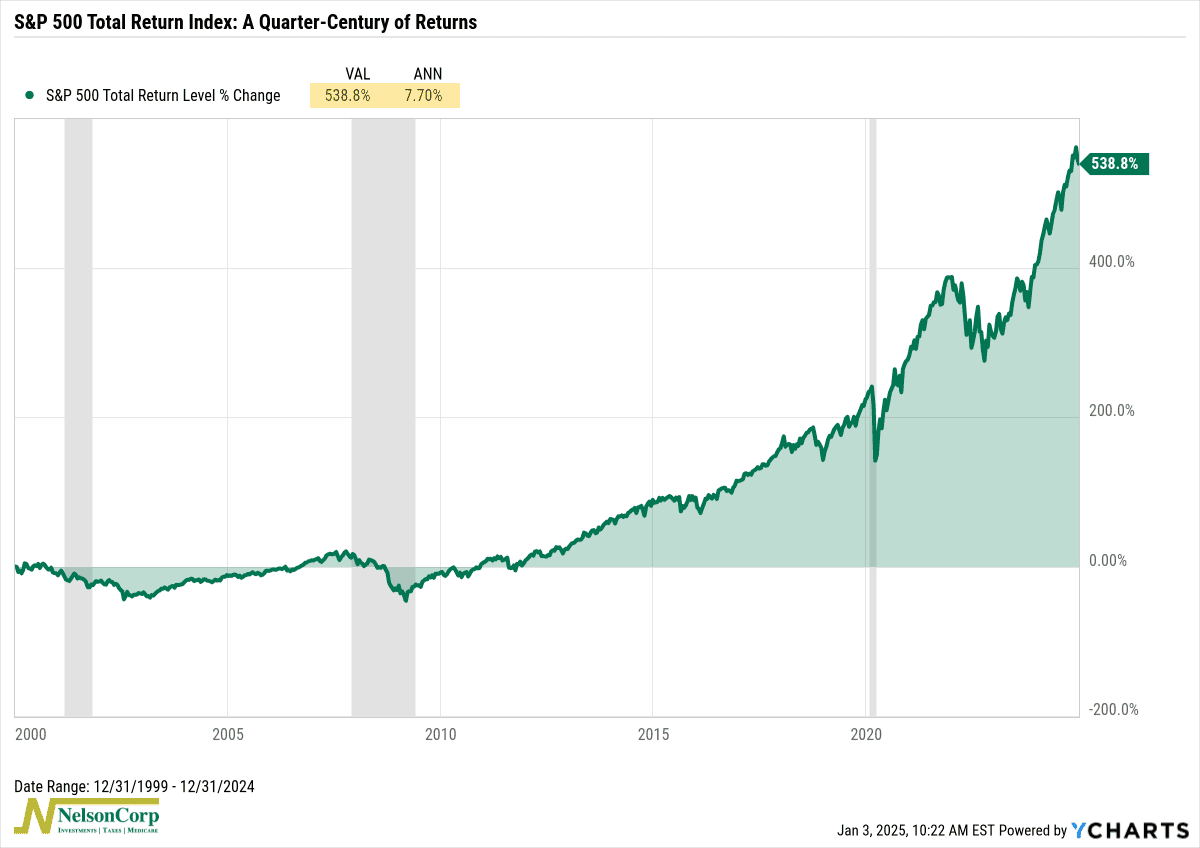
A quarter century of stock market returns is in the books, and what a journey it’s been! So, how do things stack up?
As the chart above shows, the S&P 500 Total Return Index—which includes dividends—has surged an impressive 538.8% over the past 25 years. That translates to an annualized return of 7.7% per year (before inflation). Not too shabby for investors who stayed the course.
But the journey hasn’t been without its bumps. Those shaded areas on the chart? They mark three recessions over the past 25 years. And here’s an eye-opener: the market was actually underwater until 2011—over a decade into the new century. Stocks don’t move in a straight line, and this is a clear reminder of that.
In other words, while stocks do tend to rise over time, there can be long stretches where they struggle. That’s why it’s critical to know when to lean in and play offense—and when it’s wise to play defense. Case in point: since the March 2009 low, the S&P 500 has skyrocketed more than 1,000%! That’s proof that playing offense at the right time can yield incredible results.
The bottom line? Staying invested is important, but sometimes, being cautious is the best move to protect and grow your portfolio over the long run.
This is intended for informational purposes only and should not be used as the primary basis for an investment decision. Consult an advisor for your personal situation.
Indices mentioned are unmanaged, do not incur fees, and cannot be invested into directly.
Past performance does not guarantee future results.
The S&P 500 Index, or Standard & Poor’s 500 Index, is a market-capitalization-weighted index of 500 leading publicly traded companies in the U.S.
