Something’s off.
At first glance, the S&P 500 seems to be doing OK, but something doesn’t add up. One of our key indicators—the NDR Combination High-Low Logic Index—is running hot. And when this thing gets too high, history says it’s a warning.
Let’s talk about why.
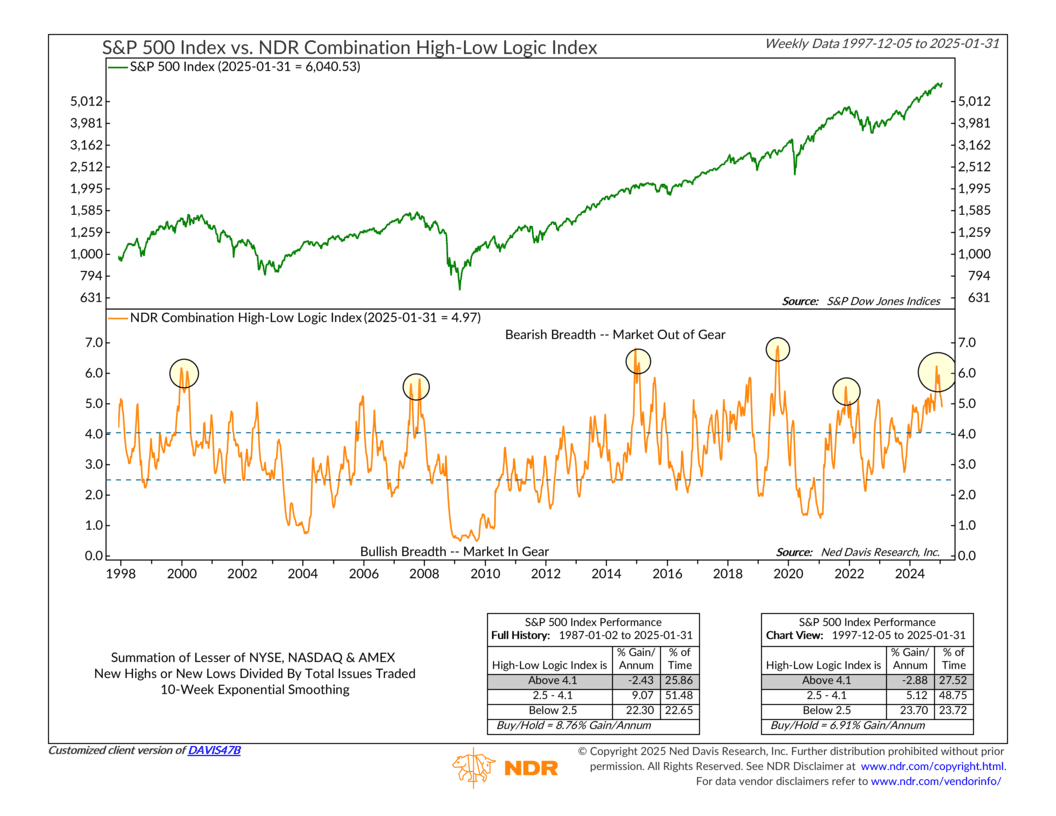
This week’s featured indicator measures market breadth—the overall health of a rally—by looking at new highs and new lows among individual stocks in the stock market. Specifically, it takes the lower of the two and divides it by total stocks traded.
A low reading is bullish. It means stocks are moving together, either rising steadily in a strong bull market or nearing the end of a deep correction. But a high reading? That’s when things get worrisome. Too many new highs and too many new lows mean the market is out of sync. Stocks are pushing to extremes—some soaring, some crashing—rather than moving in unison.
Take a look at the chart. The orange line is the High-Low Logic Index. The dotted lines give some reference points. Below 2.5? That’s when markets are “in gear”—moving together in a healthy trend. Above 4.1? That’s trouble. That’s an “out of sync” market. Historically, when this indicator spikes, corrections tend to follow.
Notice the past peaks, highlighted with circles. In 2000, 2007, 2015, and 2018, this indicator surged before major market pullbacks. And now? It’s back near those danger levels.
The historical data backs it up. When the index is below 2.5, the S&P 500 has posted an annualized return of 22.3%. When it’s above 4.1? Returns drop to negative territory (-2.4%).
So where does that leave us?
Right now, the stock market is trying to push higher. But the cracks are forming. In a healthy bull market, new highs should dominate, and new lows should be scarce. That’s not what’s happening. Too many stocks are breaking down even as the index climbs.
Does that mean a downturn is imminent? Not necessarily. But when an indicator like this starts flashing warnings, it’s worth paying attention.
This is intended for informational purposes only and should not be used as the primary basis for an investment decision. Consult an advisor for your personal situation.
Indices mentioned are unmanaged, do not incur fees, and cannot be invested into directly.
Past performance does not guarantee future results.
The S&P 500 Index, or Standard & Poor’s 500 Index, is a market-capitalization-weighted index of 500 leading publicly traded companies in the U.S.