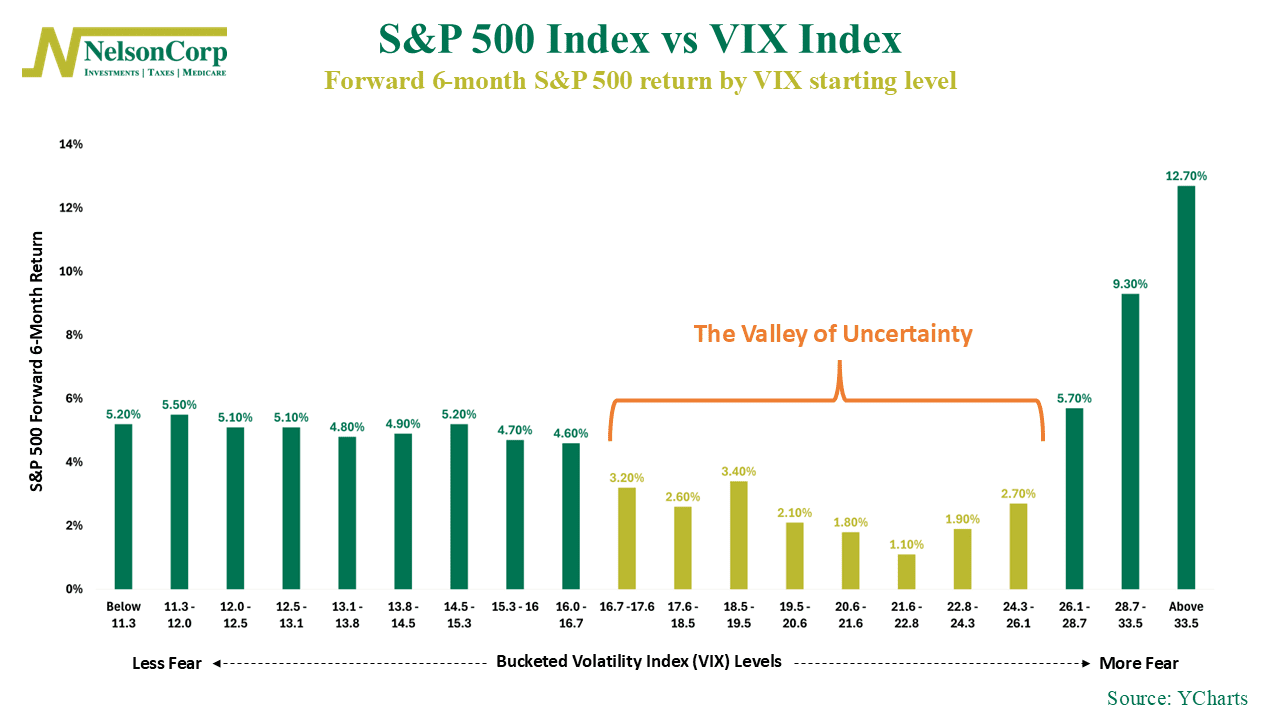
If you’ve felt like the market’s been spinning its wheels lately, this week’s featured chart might explain why.
It looks at the VIX Index—Wall Street’s so-called “fear gauge”—and shows how the S&P 500 tends to perform over the next six months depending on where the VIX starts.
To make sense of it, it helps to break the chart into three distinct zones.
The first zone, on the left-hand side, is bull market territory—where confidence is high and fear is nowhere to be found. The VIX is low here, below 16.7. In this range, life is good. Investors are relaxed, headlines are quiet, and the market tends to chug along nicely. Forward returns are consistent and positive, usually around 5% or so.
Now jump to the other end of the spectrum—when the VIX shoots above 27. That’s full-blown panic mode. This is when things feel terrible. Bad news is everywhere, and people start talking about stuffing cash under the mattress. But funny enough, this is actually where the market tends to do best going forward. When fear hits those extreme levels, it usually means the worst has already happened. The S&P 500 has historically posted some of its strongest six-month gains starting from this zone. It’s peak fear—but also peak opportunity.
And then there’s the in-between. The messy middle. I like to call it the Valley of Uncertainty. This is where we are now. VIX levels between roughly 17 and 26 signal a market that’s nervous but not panicked. There’s just enough fear to keep people on edge, but not enough to wash out the worry. And what happens in this range? Not much. Forward returns are pretty underwhelming. The market kind of meanders, waiting for a sign, a shock, or a shift in direction.
The bottom line? Until we get out of the Valley of Uncertainty, the market will likely continue along a bumpy path. Whether we break back toward calm or plunge into panic, history suggests that clearer skies—and better returns—tend to follow once we’re out of the fog.
This is intended for informational purposes only and should not be used as the primary basis for an investment decision. Consult an advisor for your personal situation.
Indices mentioned are unmanaged, do not incur fees, and cannot be invested into directly.
Past performance does not guarantee future results.
The S&P 500 Index, or Standard & Poor’s 500 Index, is a market-capitalization-weighted index of 500 leading publicly traded companies in the U.S.
