OVERVIEW
Markets got hammered last week, suffering their worst decline of the year. Volatility surged as the VIX spiked to 45—its highest level in over a year—underscoring the fear rippling through markets.
The S&P 500 plunged 9.08%, while the Dow Jones Industrial Average dropped 7.86%. The NASDAQ took the biggest hit, sinking 10.02%, and is now down over 19% year-to-date.
Broad-based selling hit every corner of the market. The Russell 3000 declined 9.15%, with growth stocks continuing to underperform—Russell 3000 Growth tumbled 9.60%, while value fell a slightly lesser 8.59%. Mid- and small-caps fared no better, with the S&P 400 and S&P 600 falling 9.14% and 9.10%, respectively.
International stocks were also swept up in the storm. Developed markets (EAFE) fell 6.94%, and emerging markets declined 2.96%. The U.S. dollar slipped 0.88%.
Bonds were a rare bright spot. Treasury prices surged across the curve—short-term Treasuries inched up 0.11%, intermediate terms gained 1.41%, and long-term Treasuries jumped 3.45%. Investment-grade bonds rose 0.55%, while high-yield bonds dropped 1.78%.
Commodity markets were mixed. Gold gave back some gains, falling 2.53%, and oil slid 9.16%. Corn managed a 1.54% uptick. MLPs saw the steepest drop among commodities, down 11.38%.
KEY CONSIDERATIONS
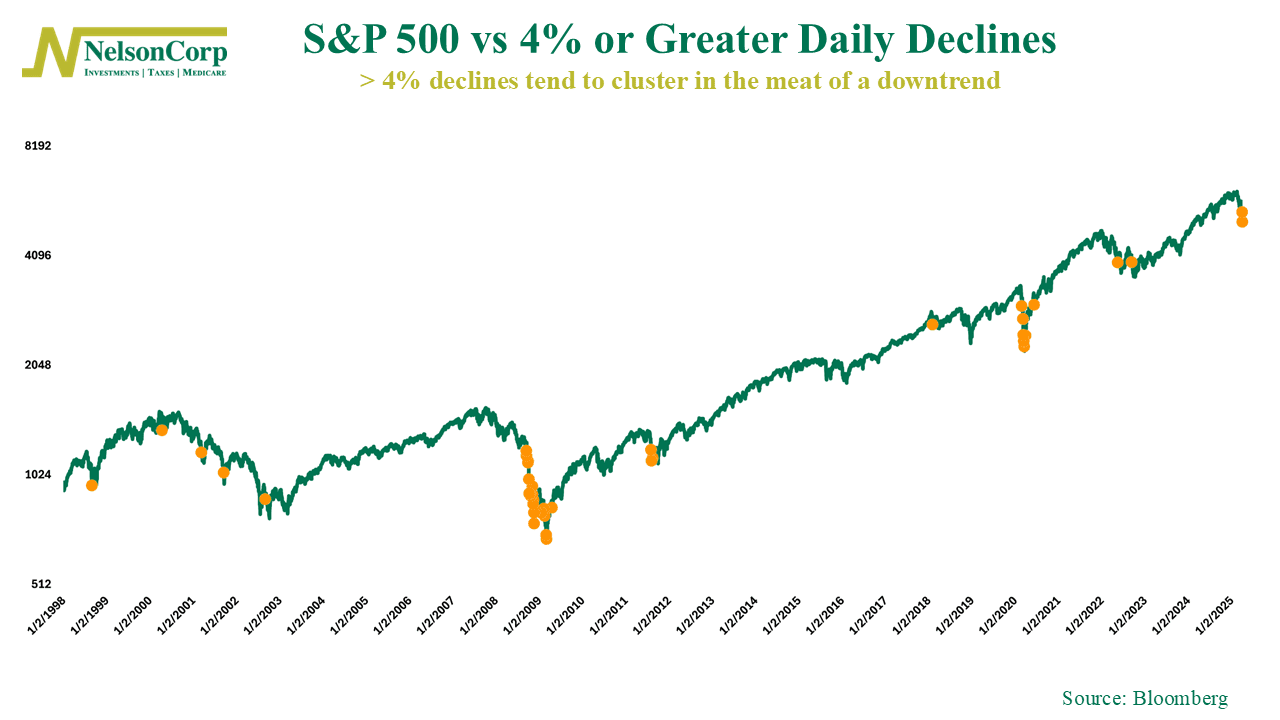
Risk Off – The S&P 500 got slammed to close the week, dropping over 4% on Thursday and then following that up with another bruising decline on Friday. The two back-to-back haymakers left markets reeling and investors wondering: Is this the bottom—or just the beginning?
History suggests it’s probably not the bottom.
The chart this week tracks every 4% or greater daily drop in the S&P 500 over the past few decades. These types of moves are rare—but when they show up, they tend to come in clusters. More importantly, they usually land in the heart of a downtrend, not at the end of one. Think Dot-Com bust, the 2008 financial crisis, COVID crash—these weren’t single-day events. They were storms that came in waves.
And this week’s storm didn’t happen in a vacuum.
The environment is clearly Risk Off. Just take a look at our Risk-On/Risk-Off Diffusion Index. As of Friday, 0% of risk-on asset classes were trending above their 200-day smoothing—while 100% of risk-off assets were. That puts the diffusion index at a rock-bottom -100, a level that historically aligns with heavy market stress, not recovery.
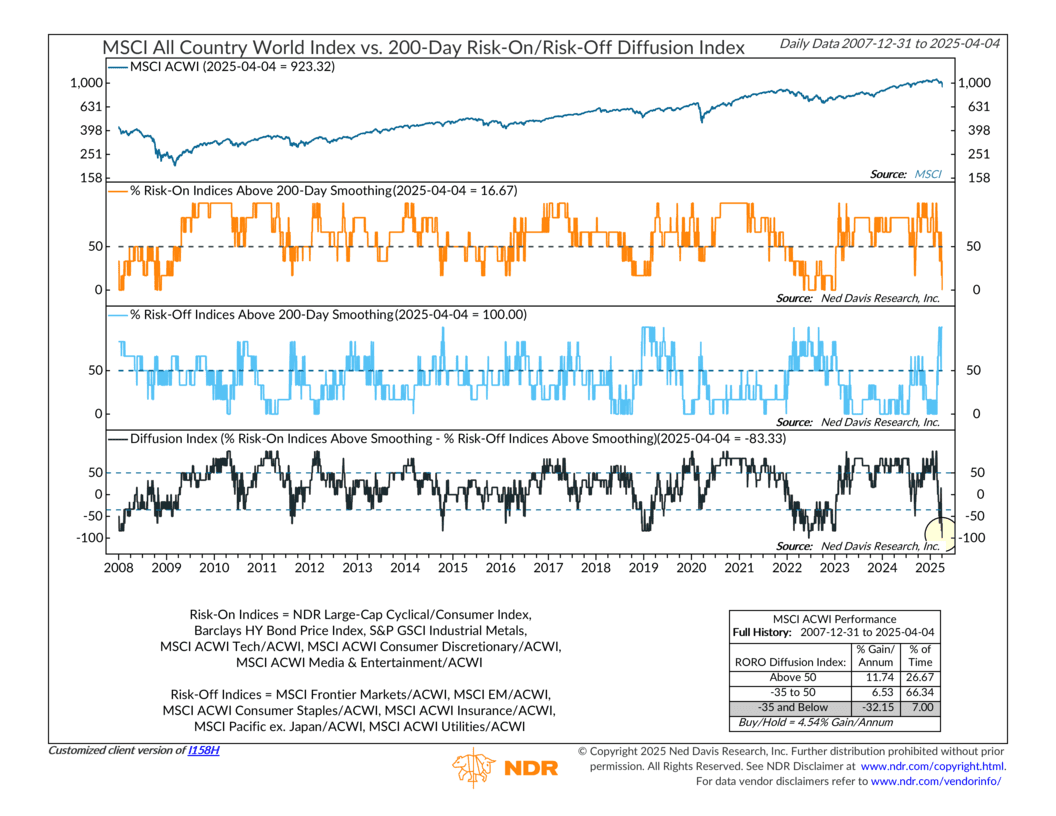
In plain English: investors are bailing on offense and hunkering down with defense.
But here’s the good news—with our Risk Aware Investment process, we don’t have to guess where the bottom is. Or the top, for that matter. We let the data guide us, adapting to the market environment instead of trying to outguess it. In times like these, discipline beats prediction every time.
That’s why we’ve been positioned defensively since December. Our models have consistently pointed toward caution, even before this latest storm rolled in. It’s not always exciting, but in volatile markets, playing defense can be the smartest offense.
This is intended for informational purposes only and should not be used as the primary basis for an investment decision. Consult an advisor for your personal situation.
Indices mentioned are unmanaged, do not incur fees, and cannot be invested into directly.
Past performance does not guarantee future results.
The S&P 500 Index, or Standard & Poor’s 500 Index, is a market-capitalization-weighted index of 500 leading publicly traded companies in the U.S.