OVERVIEW
Markets staged a fierce comeback last week, delivering their strongest rally of the year.
The S&P 500 surged 5.70%, snapping back from recent lows. The Nasdaq led the charge with a blistering 7.29% gain, while the Dow rose 4.95%. Despite the bounce, major indexes remain in the red for the year, with the Nasdaq still down over 13%.
Gains were broad but especially strong in growth stocks—the Russell 3000 Growth Index jumped 7.31%, outpacing the 3.26% rise in value stocks. Mid- and small-caps lagged behind, with the S&P 400 and S&P 600 rising 2.79% and 0.76%, respectively.
International equities also edged higher. Developed markets (EAFE) rose 0.72%, while emerging markets bucked the global trend, falling 3.90%. The U.S. dollar weakened again, down 2.87% for the week.
Bond markets didn’t fare as well. Yields rose sharply, dragging down prices—long-term Treasuries tumbled 6.53%, intermediate bonds fell 2.35%, and even TIPS lost 2.38%. Investment-grade corporates slipped 2.82%, while high-yield bonds dipped 0.70%.
Commodities were mixed. Gold rallied 6.89%, and corn jumped nearly 8%. Oil dropped 2.15%, while real estate and MLPs lost ground, down 0.68% and 1.53%, respectively.
KEY CONSIDERATIONS
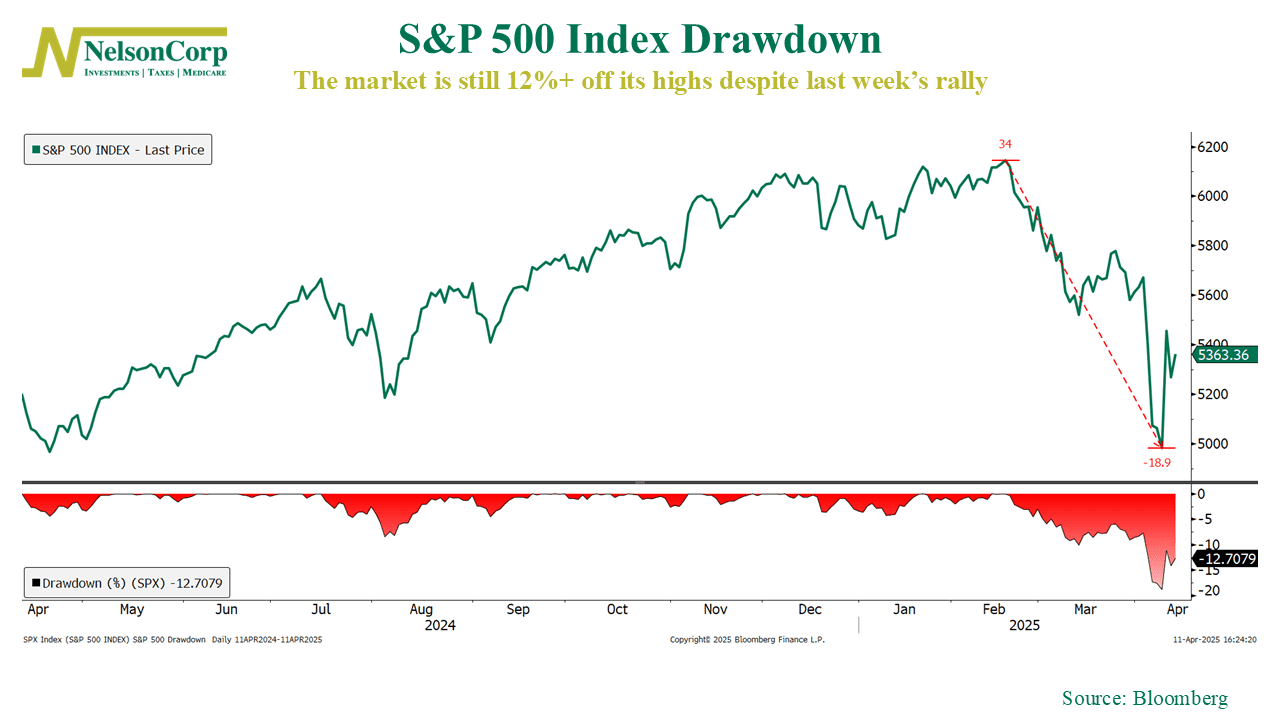
Fundamental Match – It was another wild week on Wall Street—plenty of selling, and plenty of buying, too. Wednesday’s massive reversal and rally pushed the S&P 500 up nearly 6% for the week. Not bad for five days’ work.
That said, the index was already down nearly 19% from its all-time high before the rebound, so we’re still sitting on a 12%+ drawdown as of this writing.
There’s a lot we could unpack here. As the old saying goes, there are decades where nothing happens, and weeks where decades happen—and this past week felt like one of those. But when it comes to the stock market, I want to zero in on what matters most right now: the fundamentals.
So, what are the fundamentals? Simply put, earnings drive stock prices. That’s why we invest in the first place—because the companies behind the ticker symbols are real businesses, and when those businesses earn more, their stock prices usually follow. That’s the whole point.
To assess where markets stand, we use tools like the price-to-earnings ratio—also known as the P/E multiple. You take the current price of the S&P 500 and divide it by the expected earnings per share. For example, if the index is at 100 and expected earnings are $5, you get a P/E of 20. That means investors are willing to pay 20 times those expected earnings today.
That multiple reflects how confident investors are in future profits. And that’s useful, because it helps us estimate what a “fair” value might look like for the market under different earnings outcomes and confidence levels.
The table below shows exactly that—a matrix of potential fair values for the S&P 500 based on a range of earnings and P/E multiples. The colors highlight whether each outcome is higher or lower than where we are now.
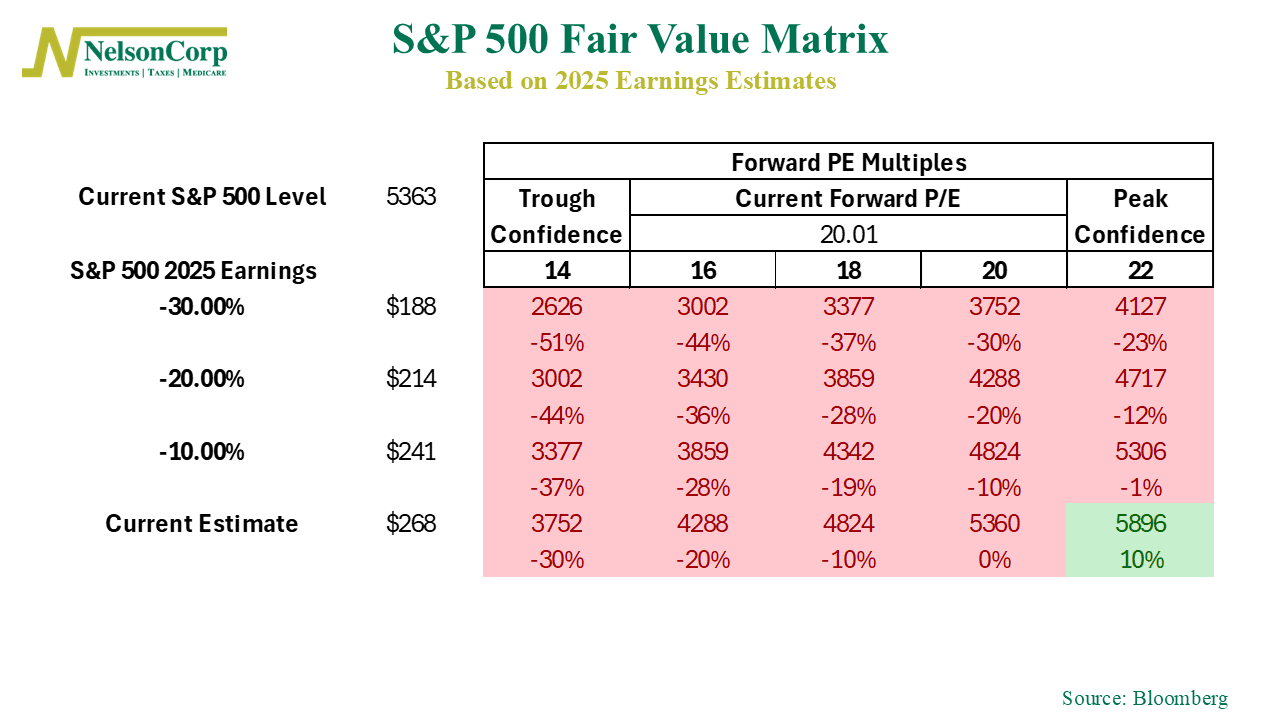
It’s a lot of numbers, I know. But here’s the key takeaway: there’s a lot of red. That suggests the market already has a strong level of confidence in the earnings outlook. To get another 10% upside from here, we’d need earnings to hit expectations and the P/E multiple to rise from an already elevated 20 to 22—which is basically peak optimism.
You might think that’s a stretch given everything going on right now. So instead, let’s look ahead to next year’s earnings. That’s where most of the market’s attention seems to be focused anyway.
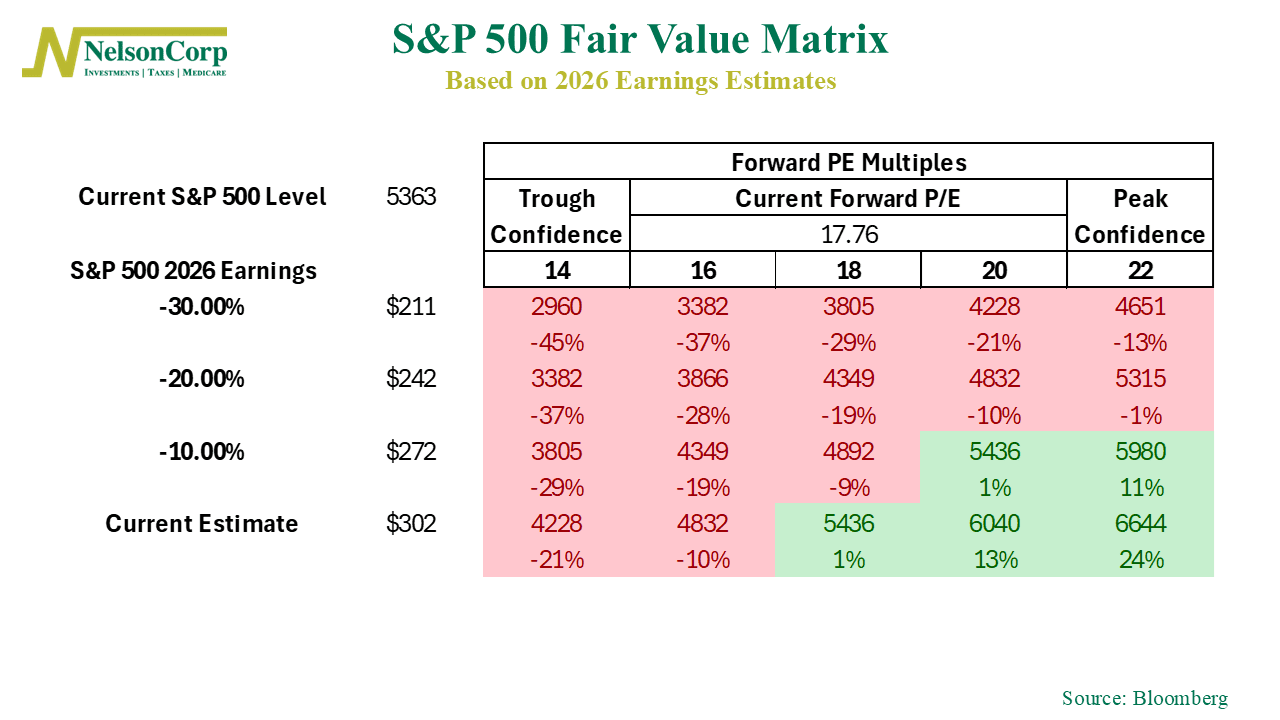
Next year’s earnings are currently projected at about $302/share. Based on that, the S&P 500 is trading at a forward multiple between 17 and 18—moderate confidence territory. But if those earnings estimates slip just 10%, we’re not out of the woods yet. More downside is still on the table.
To hit a new all-time high this year, the market would need to rally another 14%, up to around 6145 on the S&P. For that to happen, next year’s earnings would need to hold at $302, and investor confidence would need to rise back above a 20-multiple.
That could happen. Based on current prices, the market still seems pretty confident—and that’s because, to some extent, it got what it wanted last week: a softening in tariff policy. Unlike pandemics or financial crises, trade wars are political—and politics can reverse on a dime. That’s why valuations can stay elevated even when earnings are cloudy.
Last week was a reminder that markets still have influence. And if policymakers forget that, Wall Street won’t hesitate to remind them.
But we don’t think we’re out of the woods just yet—the market still has to prove that higher valuations are justified in an environment like this.
This is intended for informational purposes only and should not be used as the primary basis for an investment decision. Consult an advisor for your personal situation.
Indices mentioned are unmanaged, do not incur fees, and cannot be invested into directly.
Past performance does not guarantee future results.
The S&P 500 Index, or Standard & Poor’s 500 Index, is a market-capitalization-weighted index of 500 leading publicly traded companies in the U.S.