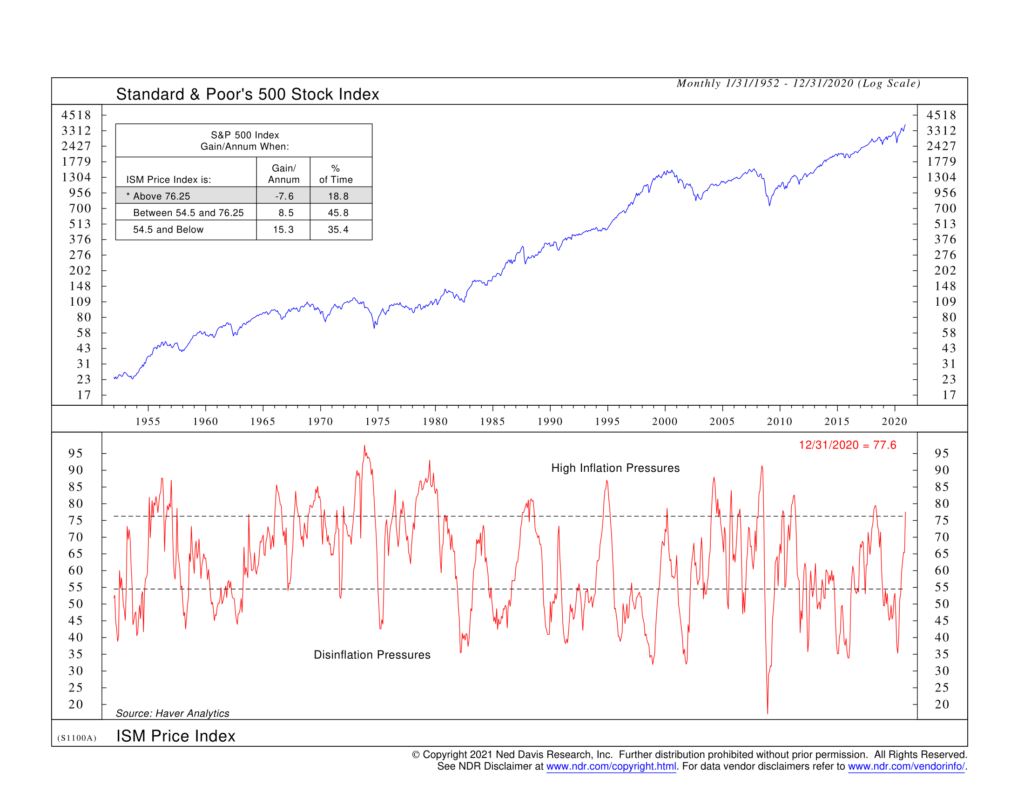
For this week’s chart, we take a peek at the Prices Paid component of the ISM Manufacturing Index. Every month, the Institute of Supply Management (ISM) conducts surveys of purchasing managers at more than 300 manufacturing firms in the U.S. and compiles the results into an index. The index is broken down into various sub-indexes like Production, New Orders, Supplier Deliveries, Employment, etc. The Prices Paid index is one such component, and it simply measures the degree to which businesses are saying they have to pay more for their manufacturing inputs.
One of the key takeaways from the December ISM report—released at the beginning of January—was that not only are products taking longer to reach their destinations, but they are also costing more. The index for Prices Paid jumped to 77.6 in December—up from 65.4 the prior month—the fastest pace of price growth since May 2018.
As our chart above shows, when the ISM Price Index is as high as it is now, the S&P 500 stock index has had a negative annual return, on average, based on data going all the way back to before 1955. This is mainly explained by effects on corporate profitability. As the price of raw materials and manufacturing inputs goes up, businesses cannot pass these costs onto consumers right away, so their gross margins suffer. If this results in lower corporate profits, stock prices take a hit.
This is intended for informational purposes only and should not be used as the primary basis for an investment decision. Consult an advisor for your personal situation.
Indices mentioned are unmanaged, do not incur fees, and cannot be invested into directly.
Past performance does not guarantee future results.
