OVERVIEW
The U.S. stock market hit new all-time highs last week, as the S&P 500 index rose 4.65%. The Dow Jones Industrial Average gained 3.89%, and the tech-heavy Nasdaq Composite jumped 6.01%.
Small-cap stocks did particularly well last week, with the Russell 2000 index gaining nearly 8%.
Foreign stocks did well, too. Developed country stocks gained about 2.7%, and emerging market stocks rose nearly 5%.
Bonds had a rough week. The 30-year Treasury bond yield jumped nearly 15 basis points, to 1.98%. Long-term Treasuries prices fell more than 2% as a result. Investment-grade bonds did better but still dropped around 0.5%. High-yield (junk) bonds, however, gained around 0.7%.
Real estate had a good week, rising about 3.7%.
Commodities overall did well. Oil led the way, gaining about 8.6%. Corn rose about a quarter of a percent. Gold, however, dropped around 2%.
The U.S. dollar strengthened, gaining about 0.5%.
KEY CONSIDERATIONS
All Together Now – The encouraging thing about this new cyclical bull market is that it has become more inclusive over time. By that, I mean that it is no longer just a few mega-cap tech companies participating in the rally. Other companies have jumped on board, too.
For example, back in late March, when the bull market was just getting underway, only about 25% of U.S. stocks were trading above their average 200-day price. Fast forward to today, however, and that number has grown to roughly 92%. In fact, it has been around 90% since November.
Even on a shorter time frame, say roughly two months, we still see quite a bit of participation from many companies. The percentage of stocks trading above their average 50-day price dropped to less than 50% near the end of January, but that reversed last week, and it is back to around 75%.
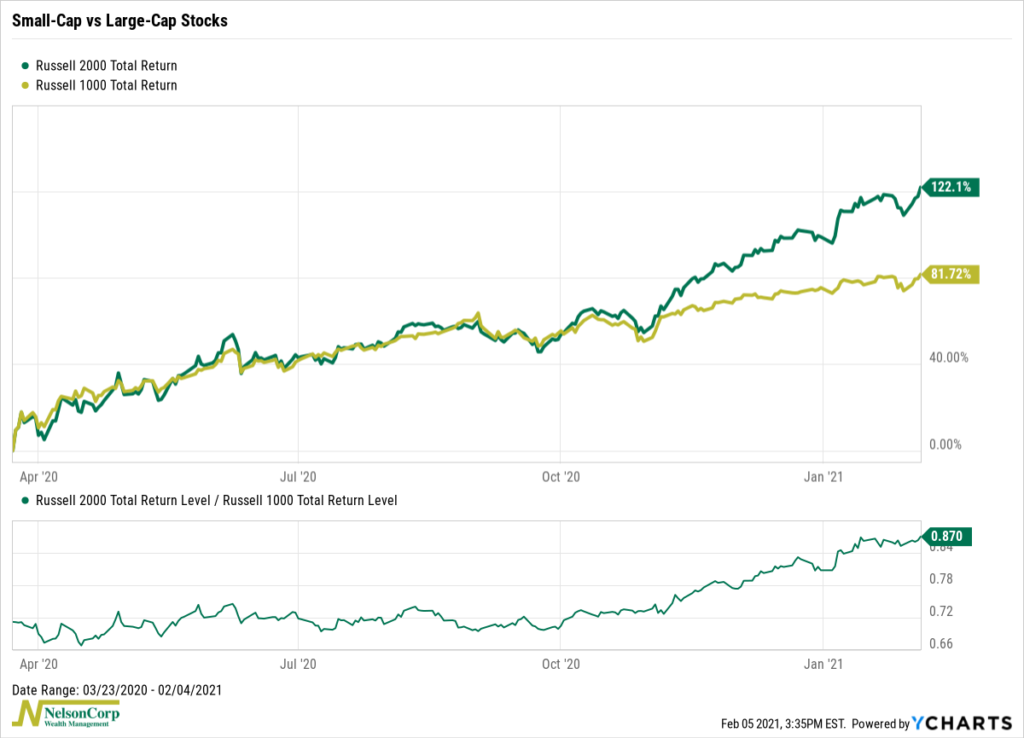
And this isn’t just large companies, either. As the chart below shows, the Russell 2000 index, representing the smallest 2,000 stocks in the U.S. stock market, has been outperforming the Russell 1000 index (the 1,000 largest stocks) lately. Since the March lows, small-caps have beaten their large-cap counterparts by roughly 40 percentage points, with most of this coming after October.

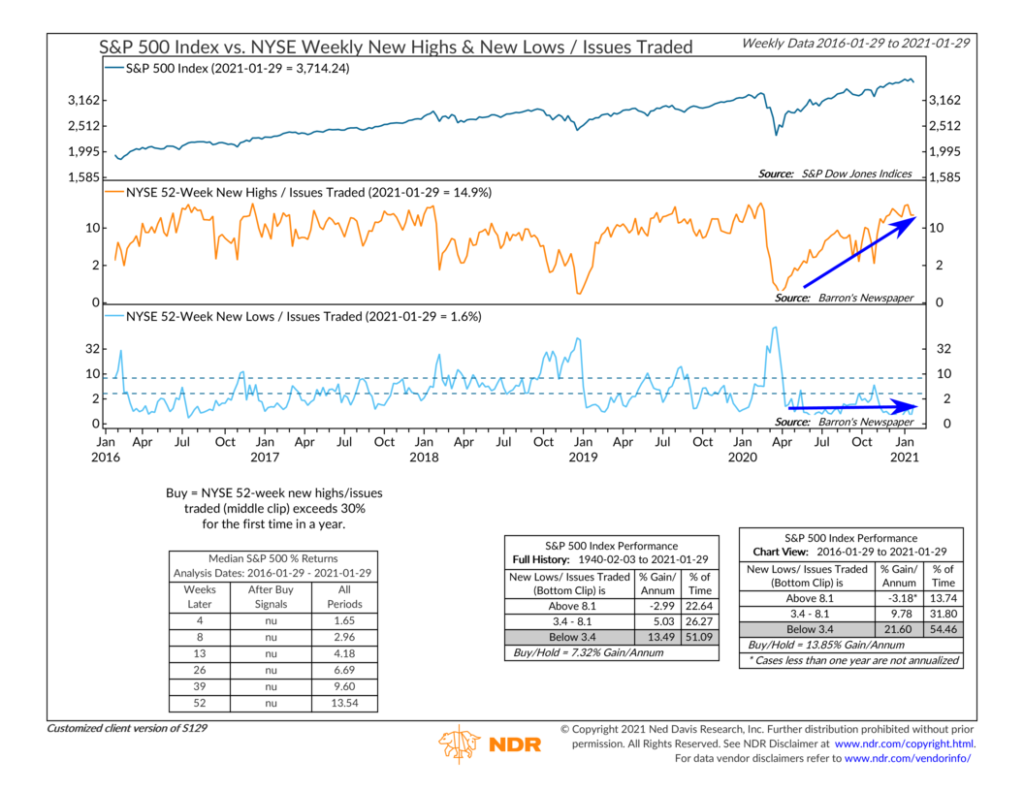
Another way to look at this increased participation is by examining the percentage of the stocks hitting new 52-week highs versus the ones hitting new 52-week lows. As the middle clip in the chart below shows, the percentage of stocks hitting new highs has climbed steadily throughout the rally and now stands at nearly 15%. By contrast, the bottom clip shows that the percentage of stocks dropping to new lows has remained low and steady since March. Historically, this has been a solid place for the stock market, with the S&P 500 returning about 13.5% per year on average going back to 1940.

A stock market with more breadth and participation from its various components is a more resilient, less fragile stock market. This added strength helps bolster the case for equities.
This is intended for informational purposes only and should not be used as the primary basis for an investment decision. Consult an advisor for your personal situation.
Indices mentioned are unmanaged, do not incur fees, and cannot be invested into directly.
Past performance does not guarantee future results.
