OVERVIEW
The U.S. stock market had a positive showing last week as the second quarter got underway and investors weighed the President’s newly unveiled $2.25 trillion spending plan.
The S&P 500 index rose above 4,000 for the first time, and its 1.14% weekly gain placed it at an all-time high. The Nasdaq Composite did even better with a 2.6% weekly gain, but it remains about 4.7% off its peak. And bringing up the rear was the Dow Jones Industrial Average with a modest weekly increase of 0.24%.
Growth stocks led the rally in the U.S., with the Russell 1500 Growth index rising 2.2%. By contrast, the Russell 1500 Value index saw a moderate weekly loss of about 0.03%.
The Russell 2000 universe of small-cap stocks also had a good week with a gain of about 1.46%.
Among foreign stocks, emerging markets led the way, rising more than 2% for the week. Developed country stock returns were more muted, rising just 0.06%.
As of Thursday’s close—when the U.S. stock market concluded trading for the week due to Friday’s holiday—the 10-year Treasury note was yielding 1.676%, a slight decline from the previous week’s close of 1.685%. However, after a half-day of trading on Friday in the bond market, the 10-year yield rose to 1.72%. Rising rates, if they persist, will continue to weigh on bond prices.
As for commodities, they had a moderate weekly decline of about 0.35%. Oil and corn were up, while gold crept lower.
The U.S. dollar was mostly flat but did edge up slightly by about 0.12% for the week.
KEY CONSIDERATIONS
Look How Far We’ve Come – The U.S. stock market just hit another one of those psychologically appealing levels. The benchmark S&P 500 index closed above 4,000 last week, its highest point ever. When stocks surpass big round numbers like this, I like to use it as an opportunity to remind myself just how far we’ve come.
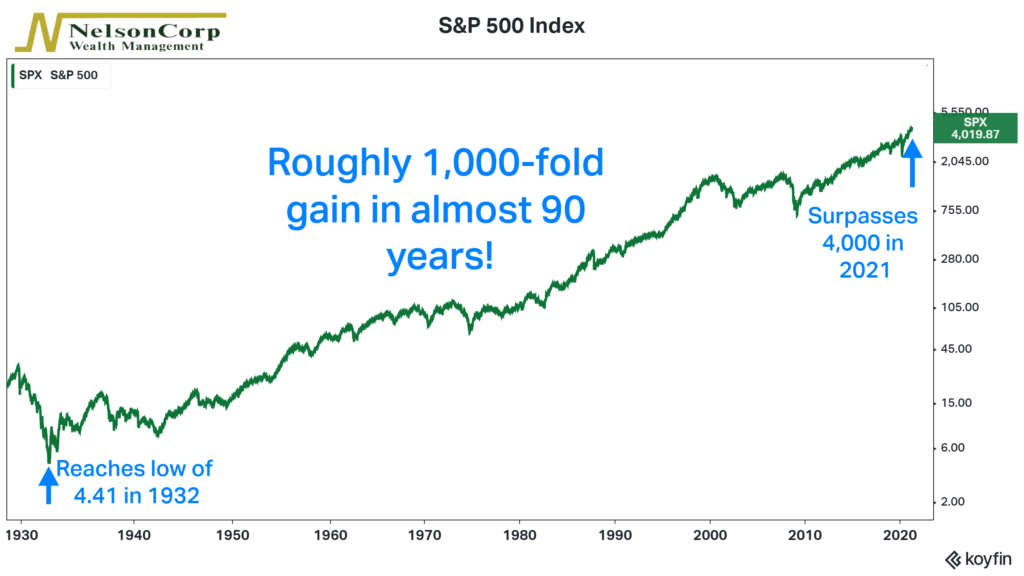
For example, during the depths of the Great Depression, the S&P 500 was trading at historically low levels. In 1932, it closed at 4.41, its lowest point ever. I’d imagine not many people were particularly optimistic about future stock returns at that time.
Fast forward about 90 years to today, however, and the S&P 500 is over 4,000. As our chart below shows, that is close to a 1,000-fold gain in the span of less than a century—and that doesn’t even include dividends!

This is amazing, given all the crazy stuff that has happened over that time. As Warren Buffet once said, “In the 20th Century, the United States endured two world wars and other traumatic and expensive military conflicts; the Depression; a dozen or so recessions and financial panics; oil shocks; a flu pandemic; and the resignation of a disgraced president. Yet the Dow rose from 66 to 11,497.”
When looking at stock returns through this (very) long-term lens, it makes sense why investors tend to have the largest bucket in their portfolios filled with equities. This is where all the long-term growth happens. And in the long run, being optimistic about corporate America has paid off handsomely for investors.
But, of course, there are some caveats. For one, the average investor doesn’t have a 90-year investment time horizon. Maybe you start socking away a portion of your paycheck into a qualified retirement account in your 20’s or 30’s. But then you start taking required distributions in your 70’s, and maybe you don’t want to take so much equity risk that late in the game. Hence, you get maybe 40-50 years to invest heavily in stocks, and probably less if you’re more risk averse.
Secondly, as you can see on the chart, stock returns don’t happen smoothly. At times, they can be quite volatile, with gut-wrenching bear markets that leave investors with no meaningful returns for many months or even years—especially in real (inflation-adjusted returns). Psychologically, this can be awfully taxing. So, if you are nearing or in retirement, it might not make sense to be heavily exposed to equity risk.
This is why we focus on managing risk more so than returns. While we remain optimistic about long-run stock returns, we know that you likely don’t have 90+ years to stick it out through the ups and downs of the stock market. Therefore, as we like to say, it’s important to know what you own—and for how long you can own it—if you want to increase your chances of reaching your financial goals.
This is intended for informational purposes only and should not be used as the primary basis for an investment decision. Consult an advisor for your personal situation.
Indices mentioned are unmanaged, do not incur fees, and cannot be invested into directly.
Past performance does not guarantee future results.
