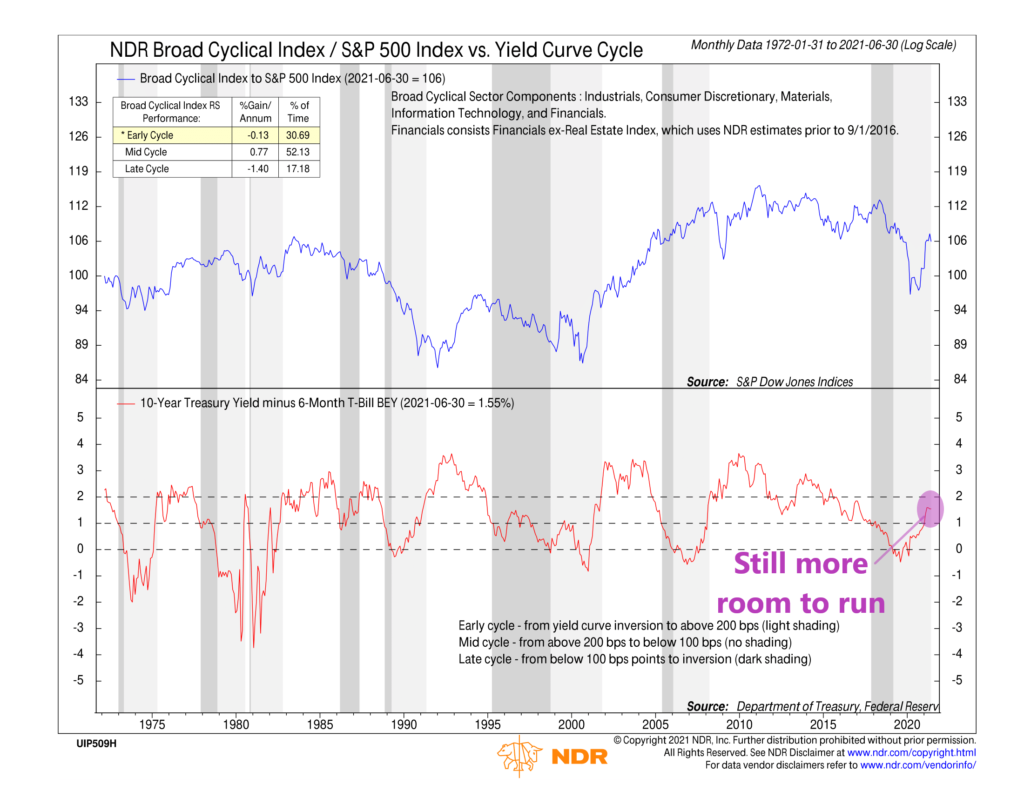
Generally, coming out of a recession like we experienced last year, the industries or sectors that are more sensitive to economic growth—Industrials, Consumer Discretionary, Materials, Information Technology, and Financials—tend to perform better than the broader market. This is because economic growth is accelerating, and faster economic growth is good for cyclical companies.
The question is: Where are we in the current cycle? The answer, according to our featured chart above, is that we are probably in the early to middle stage of this new cyclical bull market.
The chart comes to that conclusion by plotting the yield curve as the red line on the chart. In this case, the yield curve is the difference between the 10-year Treasury Note yield (long-term rates) and the 6-month Treasury Bill yield (short-term rates). When the yield curve line is falling, it means short-term rates have risen above long-term rates, a sign that investors expect economic growth and inflation to be weak in the foreseeable future. But when the yield curve line is rising, it’s a sign that economic growth and inflation are expected to accelerate, so long-term rates are climbing well above short-term rates.
The blue line at the top half of the chart shows the performance of the cyclical sectors mentioned above relative to the broader market. Historically, when the yield curve has climbed to above 200 basis points (2%) and started falling, that has been the best time for cyclical stocks. You could call this mid-cycle.
At 155 basis points (1.55%), we aren’t quite at that mid-cycle level, but that does seem to be where we are headed. The yield curve has steepened significantly this year, and cyclical stocks have responded well. Although things have cooled off in recent weeks, the takeaway from this chart is that we probably aren’t done yet. We could likely see more cyclical outperformance in the foreseeable future if the yield curve continues its upward trend.
This is intended for informational purposes only and should not be used as the primary basis for an investment decision. Consult an advisor for your personal situation.
Indices mentioned are unmanaged, do not incur fees, and cannot be invested into directly.
Past performance does not guarantee future results.
