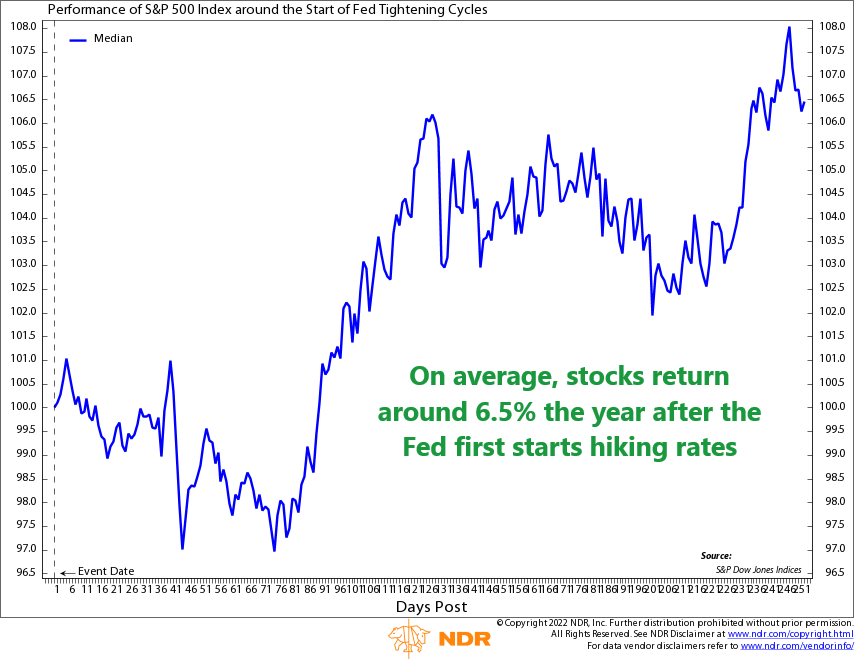
This week’s chart shows the average performance of the S&P 500 index a year after the Federal Reserve first starts a new monetary tightening cycle.
What is a tightening cycle, you might ask? It’s the opposite of an easing cycle, meaning instead of lowering rates and adding liquidity to the economy, the Fed is raising rates and draining liquidity from the system.
At first thought, it might seem like that would be a bad environment for stock market returns.
Sometimes it is. Since 1928, the Fed has embarked on a tightening cycle 14 times, and in four of those instances, stock returns were negative one year later.
However, the other ten times stock returns were positive a year later. In fact, the average (median) gain for the S&P 500 during a Fed tightening cycle is around 6.5%. Probably not what most people would expect.
This is relevant today because the Fed is expected to start raising rates as early as next month to help stem the persistently high inflation we’ve been experiencing due to the pandemic. Stocks have struggled to start the year, perhaps anticipating these rate hikes. But the good news is that, historically, returns could still be moderately higher a year after this new tightening cycle begins.
This is intended for informational purposes only and should not be used as the primary basis for an investment decision. Consult an advisor for your personal situation.
Indices mentioned are unmanaged, do not incur fees, and cannot be invested into directly.
Past performance does not guarantee future results.