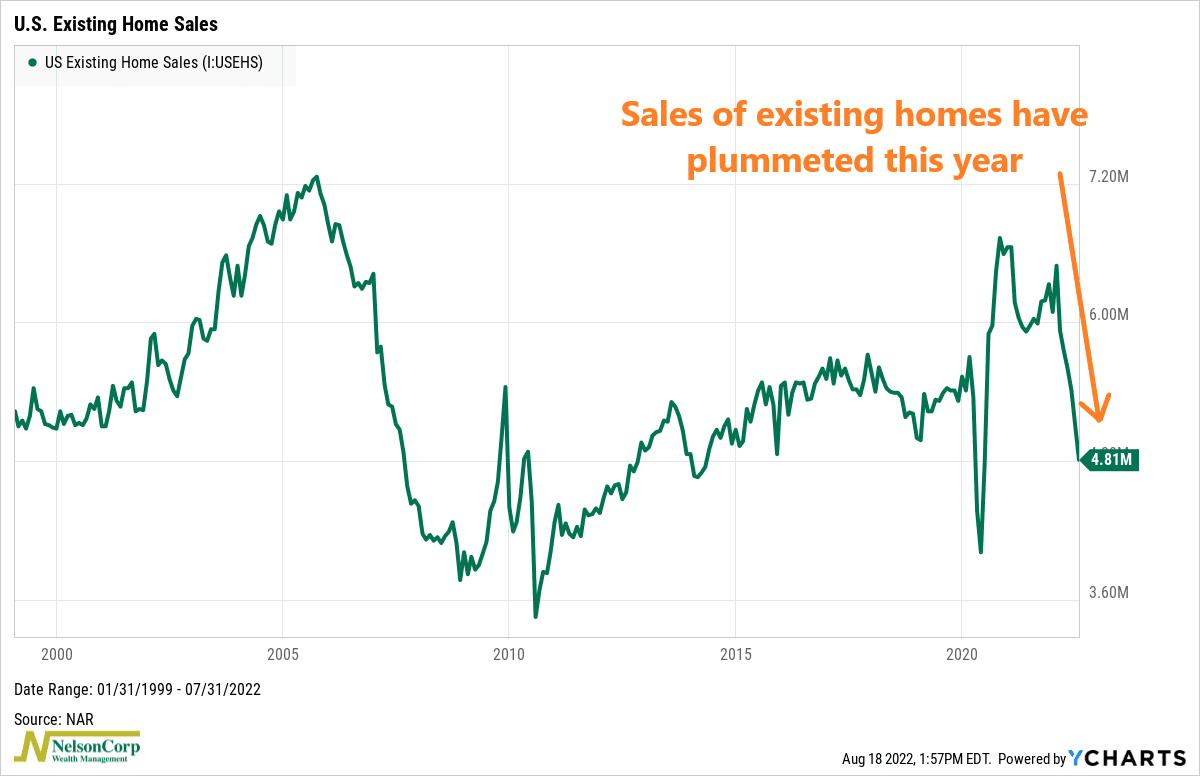
This week’s chart shows existing home sales in the United Sales going back to 1999. It tells us how many homes were sold each month—but only for homes that were already owned and occupied before coming onto the market.
As you can see, they have crashed this year. Last month, 4.81 million existing homes were sold in the U.S. That’s down 6% from June and about 20% from the same month a year ago. In fact, sales of homes have now dropped for six straight months. The last time that happened was between August 2013 and January 2014.
Why are existing home sales falling? Mainly it’s due to declining affordability. According to the National Association of Realtors, housing affordability is the lowest it’s been since 1989. The 30-year mortgage rate hit a recent high of almost 6% last month. But at the same time, home prices have remained stubbornly high. The median price of a home in July was $403,800, a 10.8% increase versus a year ago. This combination of higher rates and higher prices has formed the perfect cocktail for a collapse in affordability.
For the Fed, however, this is good news. Not only have existing home sales been falling but so have new home constructions. We found out this week that new housing starts have dropped nearly 20% from their cyclical peak in April. So, less money is flowing into the housing sector, which could take the air out of inflation.
This could lead the Fed to eventually slow their pace of policy rate increases as they pause to assess the state of economic activity and inflation. Anticipation of a less hawkish Fed could be one explanation for the recent bump we’ve seen in equities.
This is intended for informational purposes only and should not be used as the primary basis for an investment decision. Consult an advisor for your personal situation.
Indices mentioned are unmanaged, do not incur fees, and cannot be invested into directly.
Past performance does not guarantee future results.