This week’s chart is the St. Louis Financial Stress Index. It was first published by the Federal Reserve Bank of St. Louis in 2010—with data going back to 1993—to better gauge levels of financial stress in the system in the aftermath of the 2008 financial crisis.
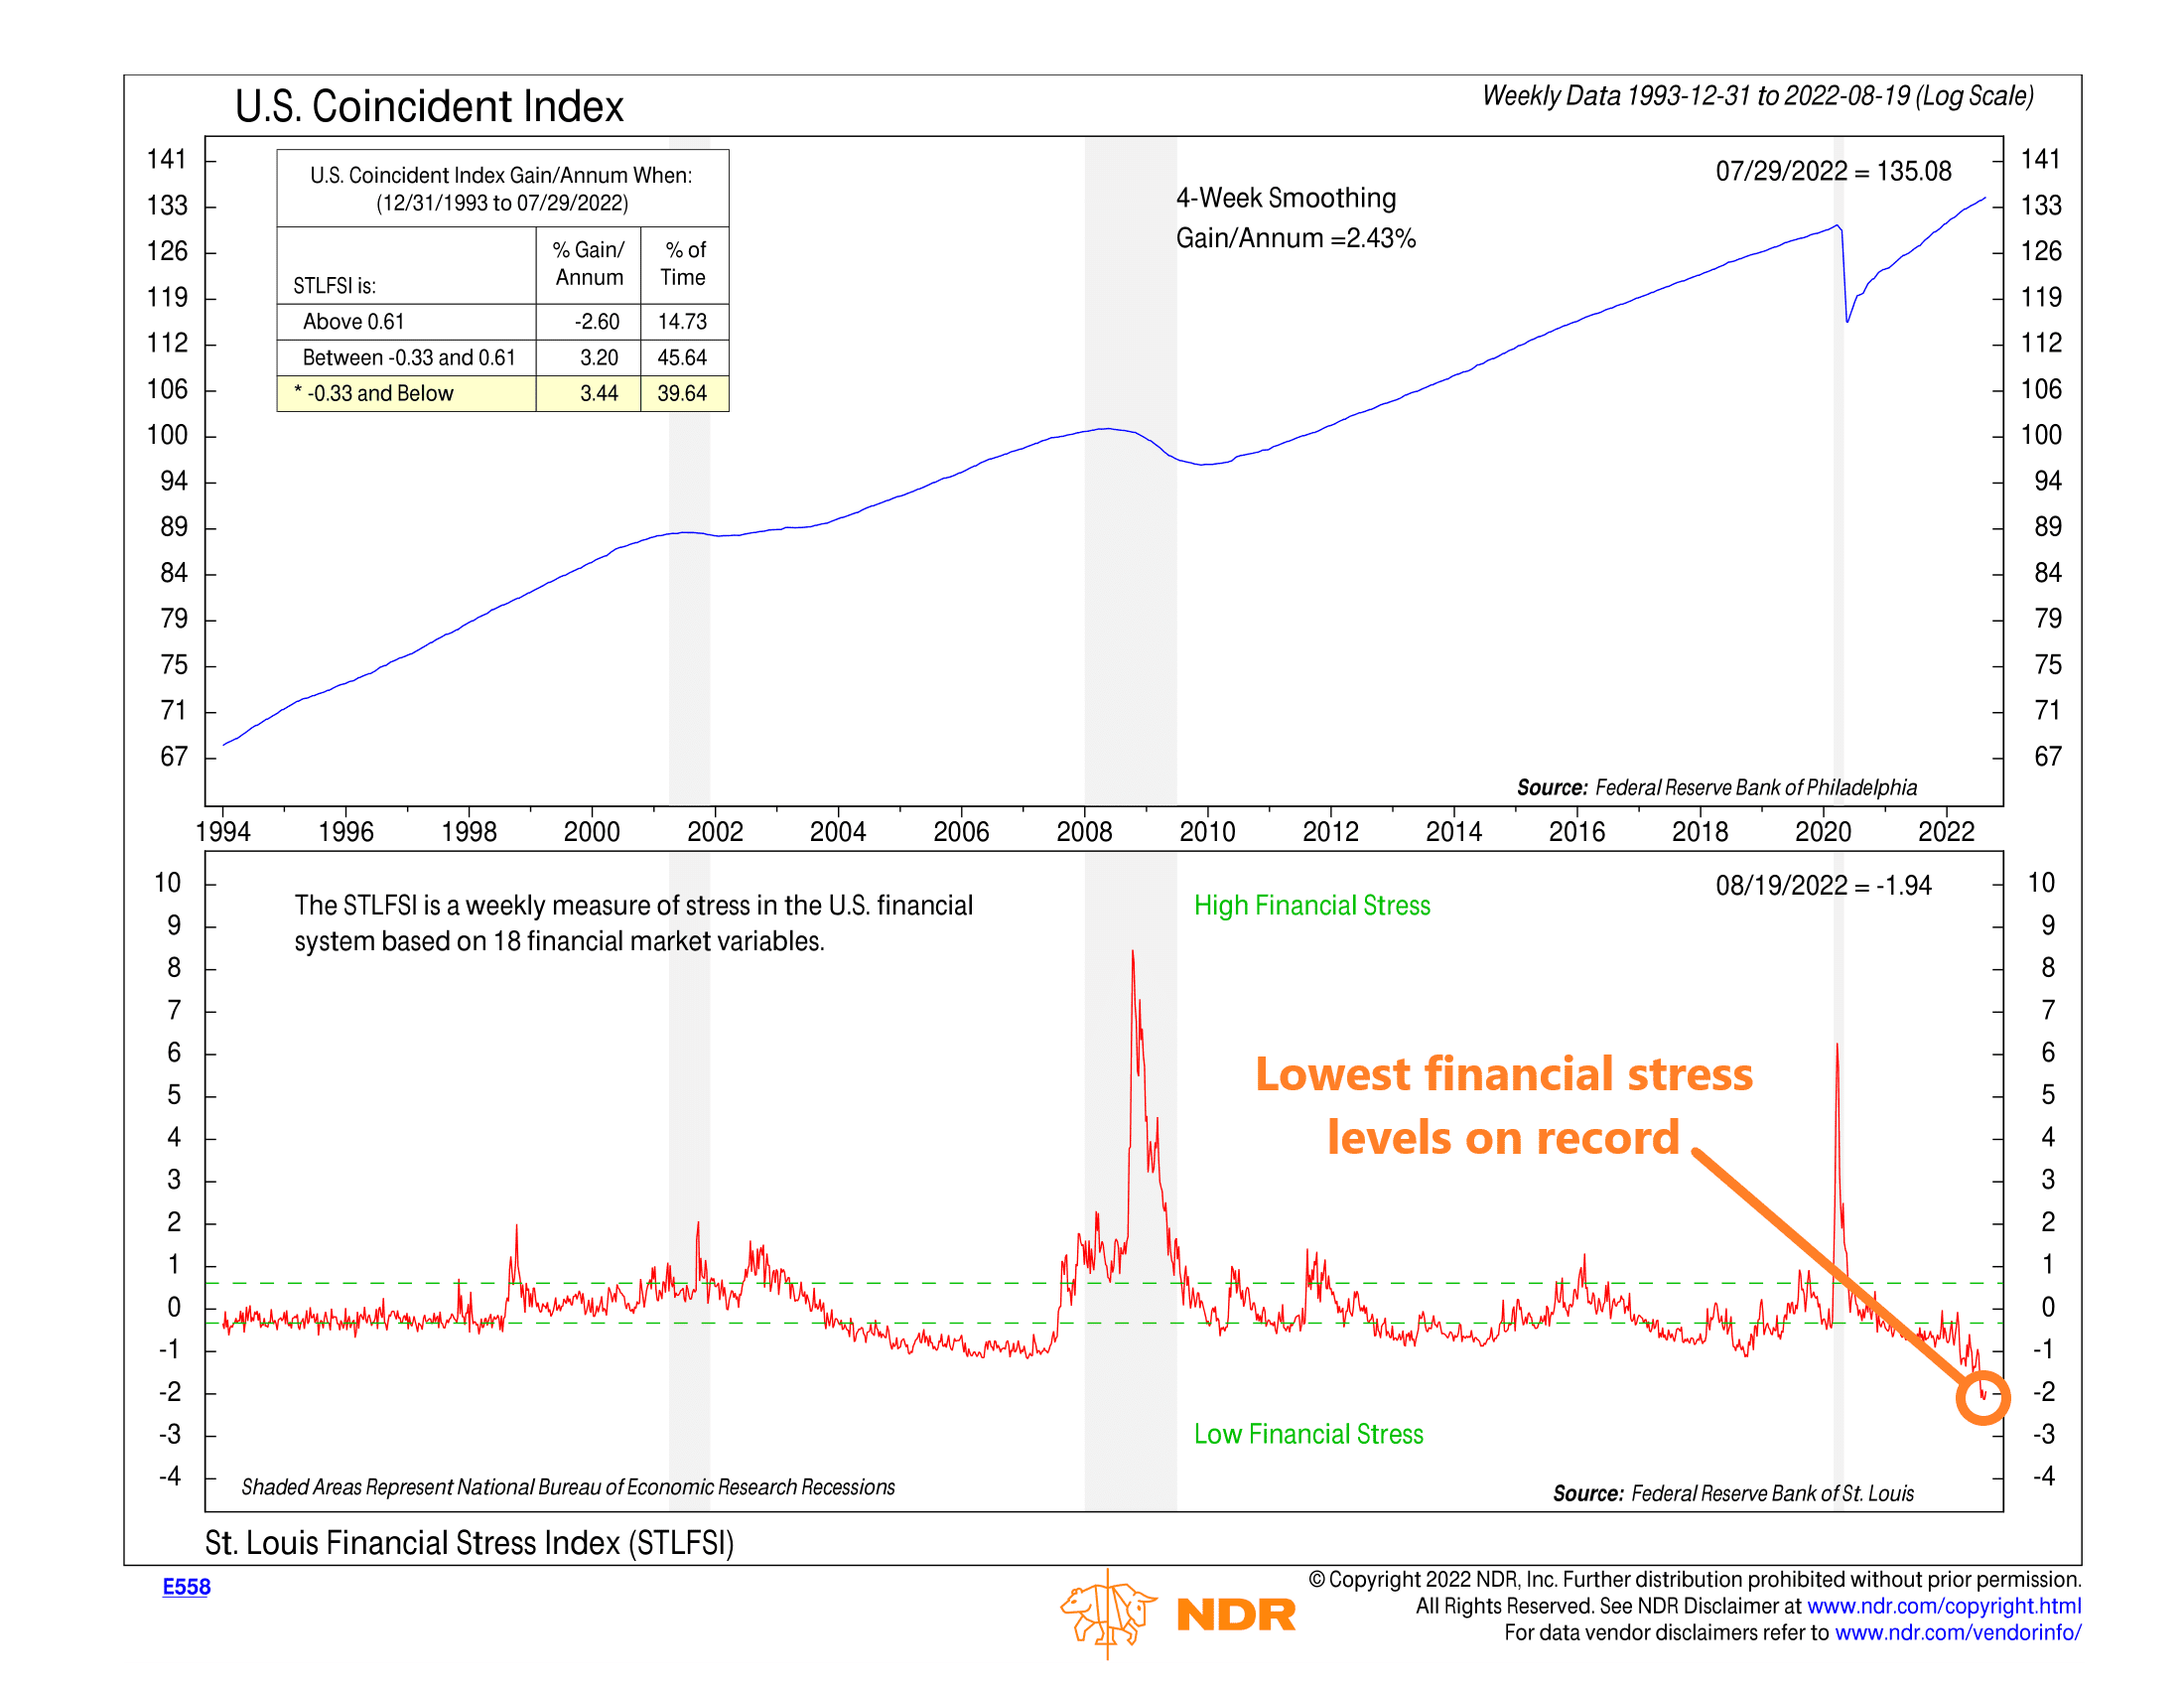
It’s a weekly measure of stress in the U.S. financial system based on 18 financial market variables. The variables include things like Treasury and corporate interest rates, yield spreads, emerging market bonds, equity volatility, bond volatility, and long-term breakeven rates.
A positive value indicates that financial market stress is above the long-run average, while a negative value signifies that financial stress is below average. You can see how the measure spiked in the 2008 financial crisis and again in the 2020 covid crisis, both of which were times of high financial market stress.
Looking at today, though, the measure is at its lowest point in history, meaning financial stress is extremely low at this time.
On the one hand, this is very good news as it means the risk of another financial crisis is low.
On the other hand, however, it likely gives the Fed a green light to continue hiking rates without worrying that it will shock the financial system, which could continue to pressure stock valuations.
This is intended for informational purposes only and should not be used as the primary basis for an investment decision. Consult an advisor for your personal situation.
Indices mentioned are unmanaged, do not incur fees, and cannot be invested into directly.
Past performance does not guarantee future results.