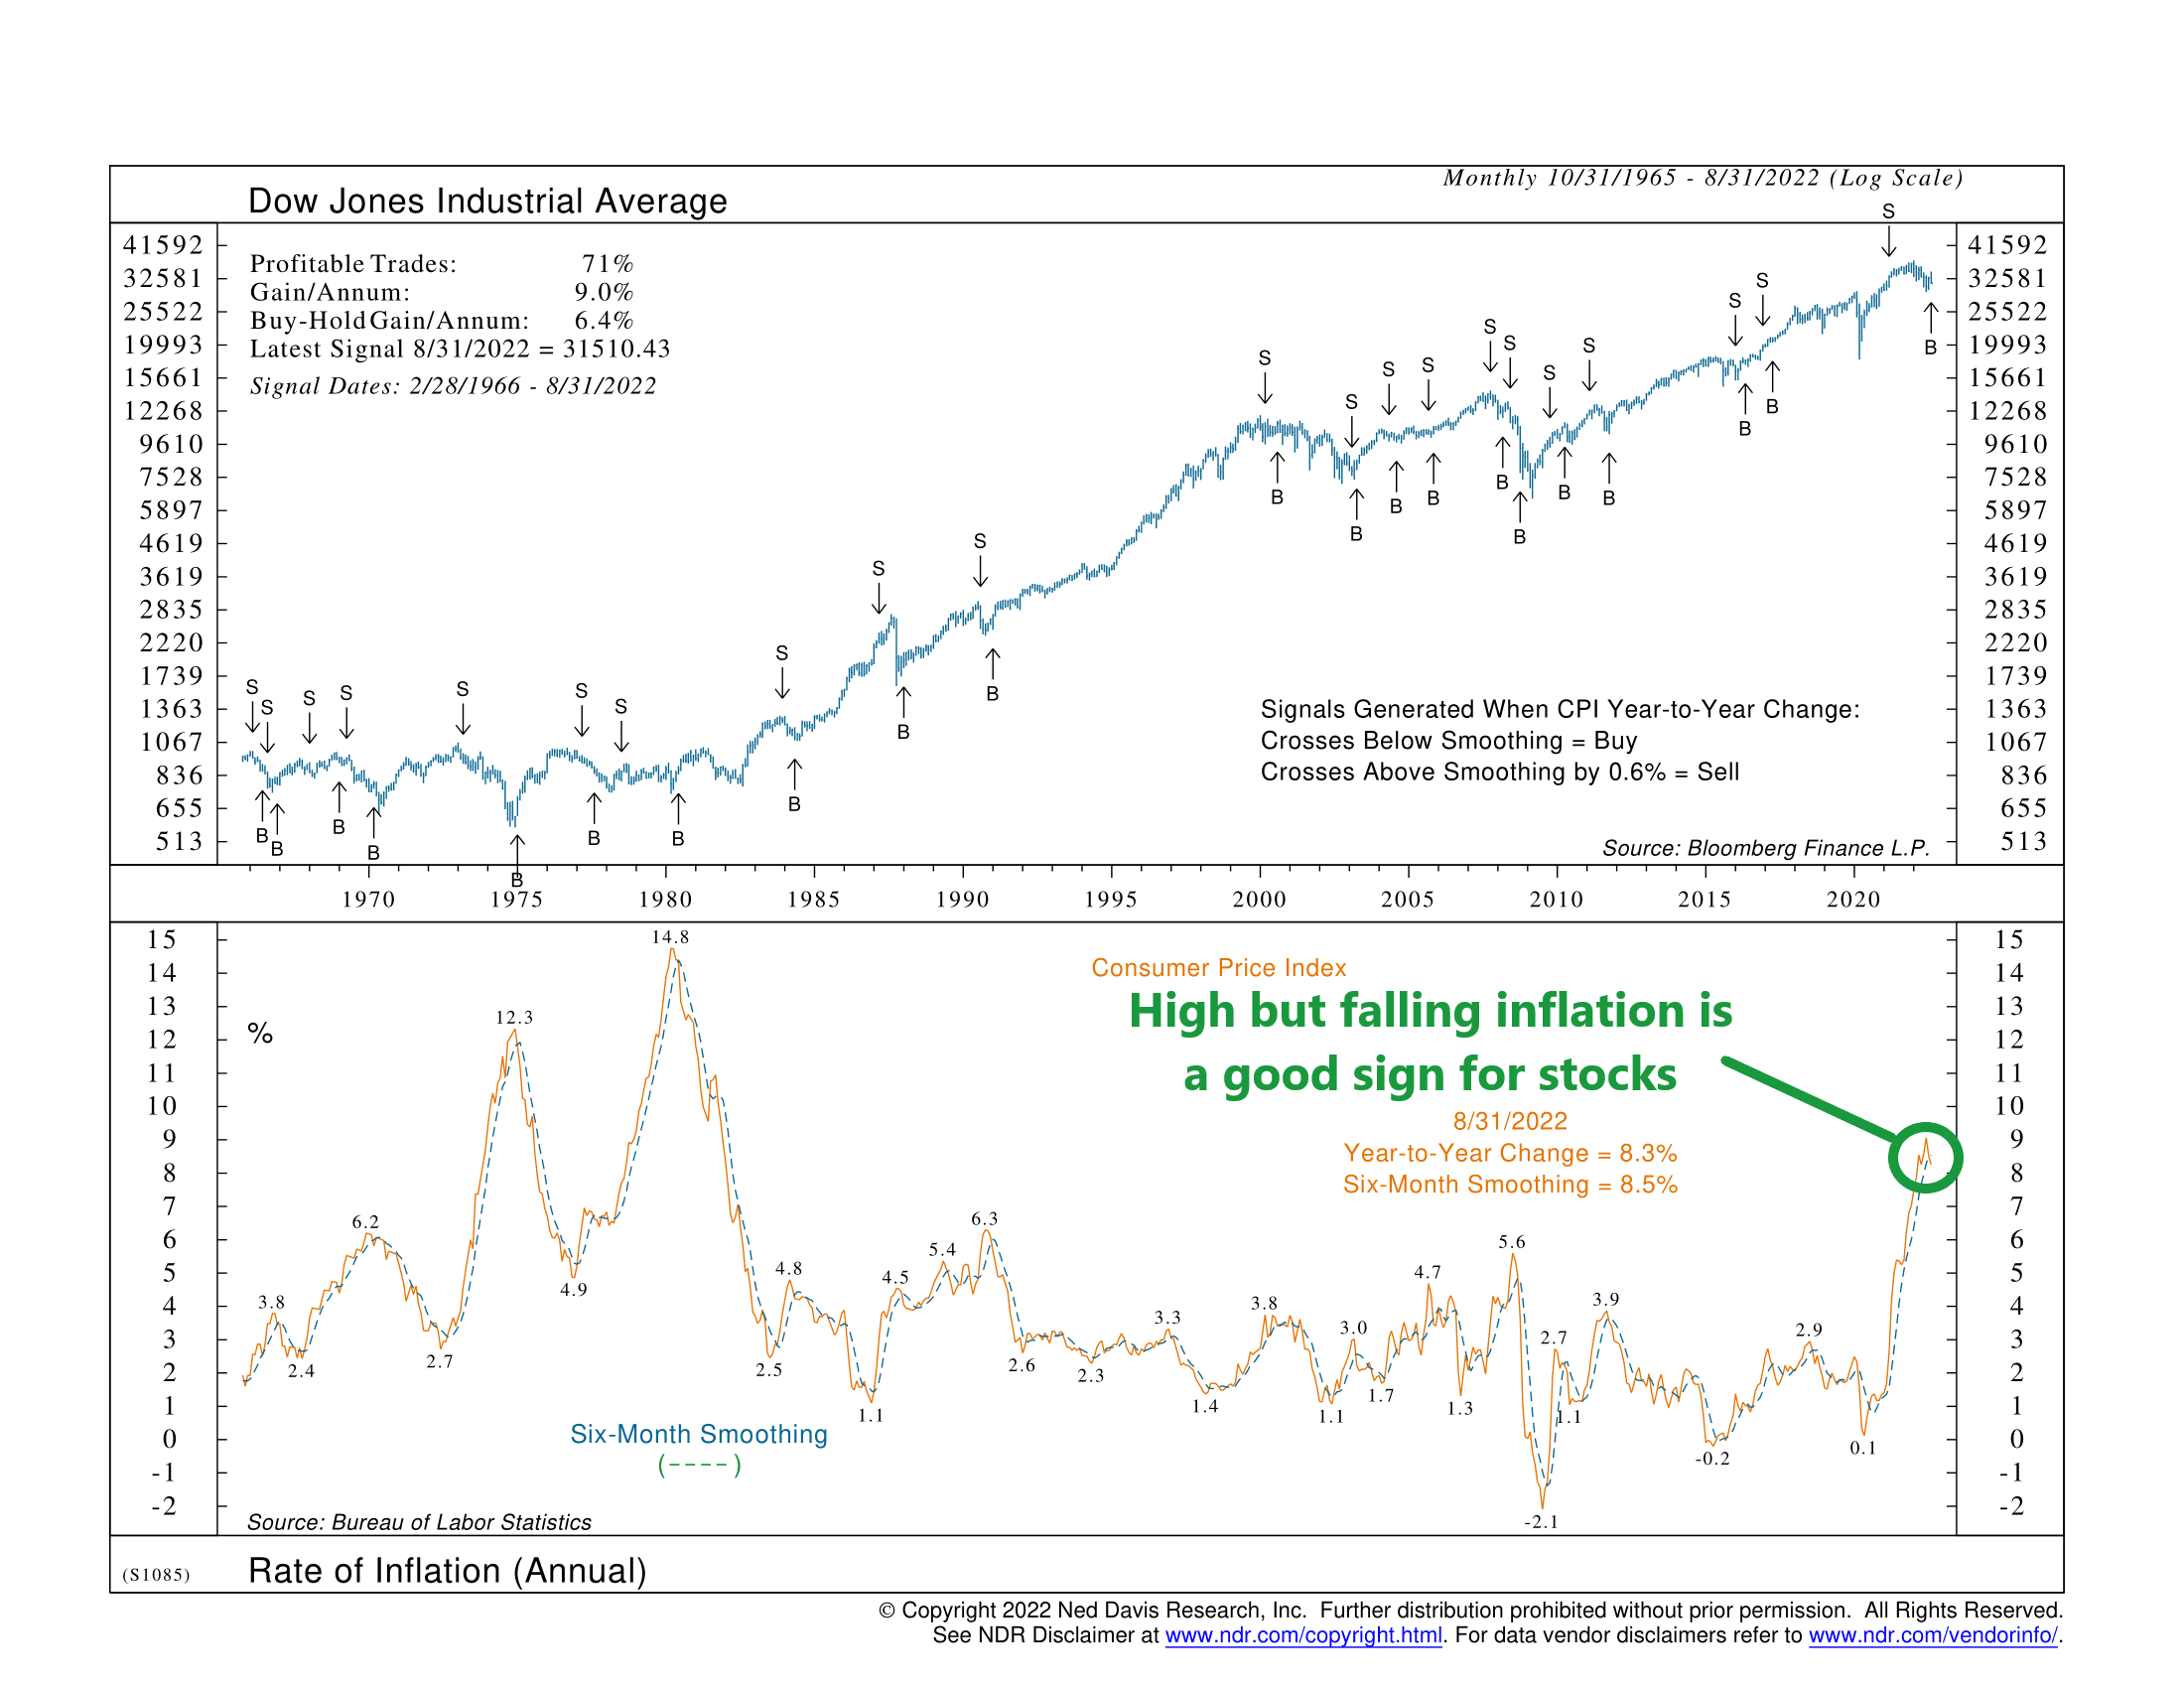
The indicator uses two main inputs: the year-to-year change in the Consumer Price Index (CPI) and the six-month smoothing or average of the CPI.
Historically, when the y/y change in the CPI crosses below its 6-month average, it has often been a positive sign for stocks. But if it rises above its 6-month average by 0.6% or more, it’s been a negative signal for stocks.
This sort of negative signal happened in the first quarter of 2021 when inflation first started becoming a problem. The CPI accelerated above its 6-month average, triggering a sell signal on the indicator. Stocks have struggled ever since.
However, the big news recently is that we finally see signs that inflation is starting to moderate somewhat. The y/y change in the CPI was 8.3% last month, compared to the 6-month average of 8.5%. This triggered a buy signal from the indicator. Historically, this condition of high but falling inflation has coincided with a positive environment for the stock market.
That’s not to say that the stock market will necessarily rip higher from here. There are still a lot of headwinds out there. But seeing this indicator improve after being bearish all year is an encouraging sign.
In fact, we would argue that this indicator is probably the chart of the year, as it best explains what has happened to the stock market. At this point, getting a positive message from an inflation-based indicator like this one is a necessary (but not necessarily sufficient) condition for any sustainable future market rally.
This is intended for informational purposes only and should not be used as the primary basis for an investment decision. Consult an advisor for your personal situation.
Indices mentioned are unmanaged, do not incur fees, and cannot be invested into directly.
Past performance does not guarantee future results.
