OVERVIEW
Despite a volatile week, the major U.S. stock indices registered gains, snapping a three-week losing streak. The S&P 500 gained 1.5%, the Dow Jones Industrial Average rose 2%, and the Nasdaq Composite climbed 0.7%.
Bonds were mixed, however. The 10-year Treasury rate rose to 3.89%, bringing intermediate-term treasuries down 0.4% for the week and long-term Treasuries down 1.3%. But corporate bonds held up better, with investment-grade bonds rising 0.15% and high-yield (junk) bonds gaining about 1.4%. Municipal bonds increased by 0.9%, and TIPS rose by 0.58%.
Real estate had another down week, falling 3.4%. But commodities had a strong week, gaining more than 5% broadly. Oil skyrocketed 15%, gold rose 2.2%, and corn increased 0.85%. The U.S. dollar strengthened by about 0.5%.
KEY CONSIDERATIONS
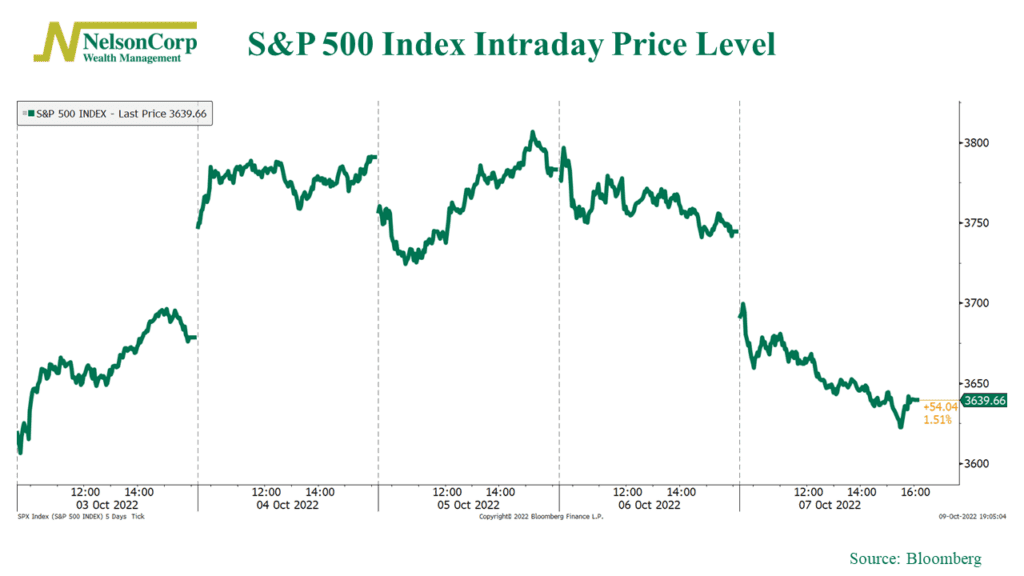
Waypoints – The stock market came out of the gate running last week and surged nearly 6% in the first two trading days. That was the S&P 500’s best two-day surge since November 2020.
But then it woke up and just fell out of bed. Over the final three days of the week, the S&P 500 lost roughly 4%. It ended the week at an index level of 3639, just 1.5% higher than the previous week’s close of 3585 (which also happens to be the low for this year).

Even if we ignore all the macro data and other outside reasons for why the market was so volatile last week, the price action still tells us most of what we need to know, which is that the stock market faces an uphill battle from here.
I like to think of it like a hiker who has descended into a deep valley. During his descent, a wise hiker will have placed little markers or waypoints along the mountainside to ensure he can find his way back to the top when he’s done. In the stock market, these waypoints are akin to key technical levels, levels that the market will need to reach if it is going to climb back to where it started the year.
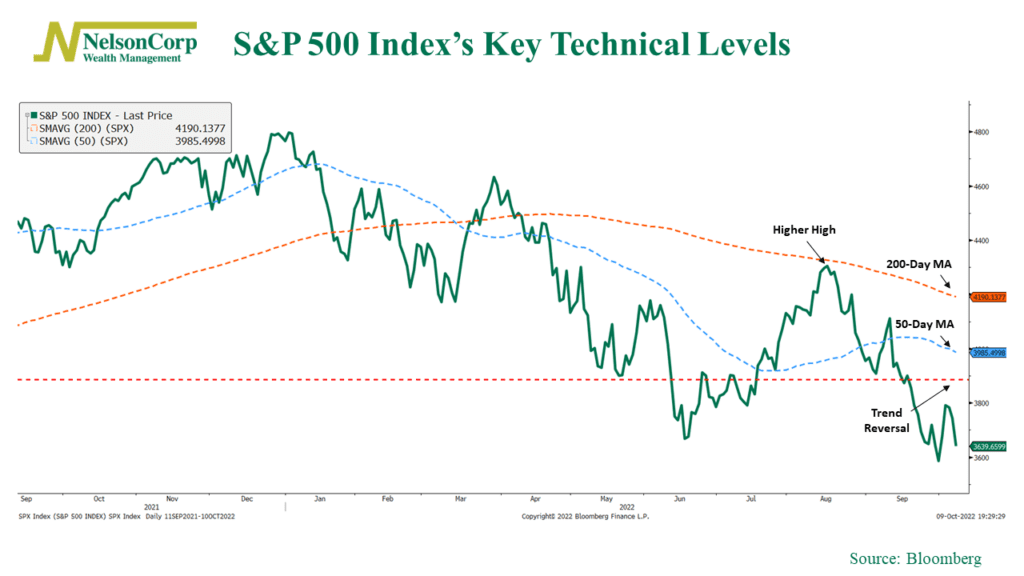
There are a ton of different ways an investor could slice and dice the market to develop these waypoints, but I will focus on just four specific technical levels that I think are the most important, shown on the chart below.

The first is what we call the “trend reversal” waypoint. This is based on an indicator we use to measure potential reversals in the stock market’s trend. Historically, an 8.4% gain or greater from a recent low is usually a sign that the market is turning a corner. This equates to about 3887 on the S&P 500, which is 8.4% higher than the September 30th low of 3585. At a current level of 3639, the S&P 500 still has another 6.8% to go before it reaches this first significant waypoint.
Up next are a couple of familiar technical levels that many analysts on Wall Street pay attention to. They are the 50-day moving average and the 200-day moving average of the S&P 500 index.
The first—the 50-day moving average—can be thought of as the short-term trend of the market, while the 200-day moving average is typically seen as a long-term measure. Right now, the 50-day moving average is about 9.5% higher than current levels, and the 200-day moving average is more than 15% higher. In other words, the market still has a ways to go.
The last key level to look for is the peak in mid-August, equating to 4305 on the S&P 500 index. The technical name for this is a “higher high” because if the market can close above this level, it would be a sign that stocks are reaching higher highs as opposed to lower lows.
Don’t get too caught up with the terminology; all you need to know is that if the market can reach this point—which is more than 18% higher from current levels—it would go a long way towards signaling that the current bear market is behind us.
What might help the market rally to these key levels?
One thing that could help is better valuations. As we pointed out in this week’s Indicator Insights blog post, the stock market is approaching “better bargain” territory. The median price-to-earnings ratio of the market is close to its 42-year average value, a sign that stocks are a much better buy at these levels than they were at the beginning of the year—assuming corporate earnings hold up.
But what if earnings don’t hold up? What might cause earnings to fall and thus keep the market from reaching the waypoints?
One word: recession. And stocks typically fall further than they have already during economic recessions.
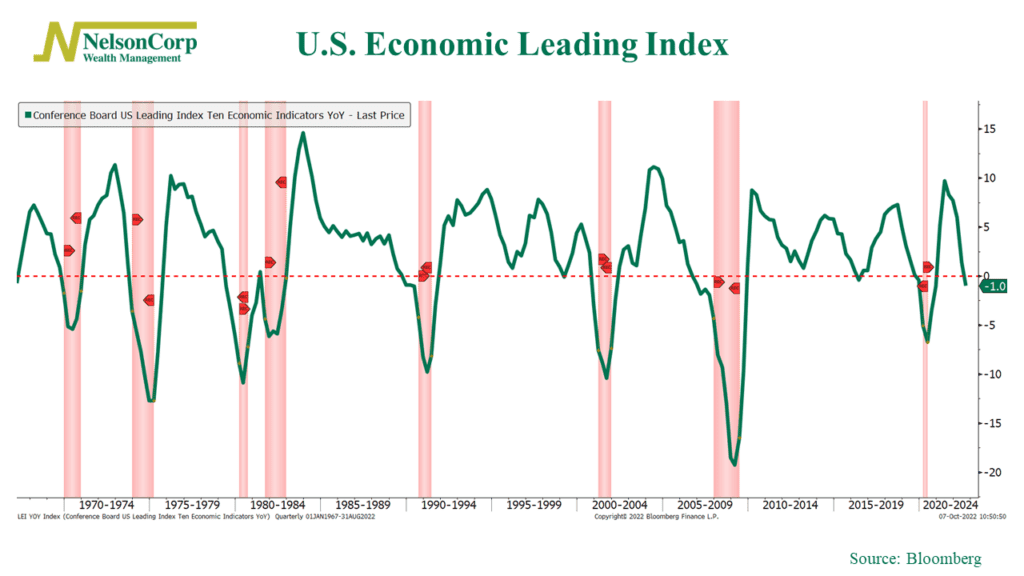
That’s why this final chart is something to keep an eye on. This is a composite of indicators that tend to lead the economy, meaning they tend to tell us where that economy is headed. When the composite falls significantly below zero, it’s a warning sign that a recession is right around the corner.

Currently, the composite is at a reading of -1. So, this means we should be on the lookout for further deterioration from here, as it could be a warning that an economic slowdown is afoot.
This is intended for informational purposes only and should not be used as the primary basis for an investment decision. Consult an advisor for your personal situation.
Indices mentioned are unmanaged, do not incur fees, and cannot be invested into directly.
Past performance does not guarantee future results.
