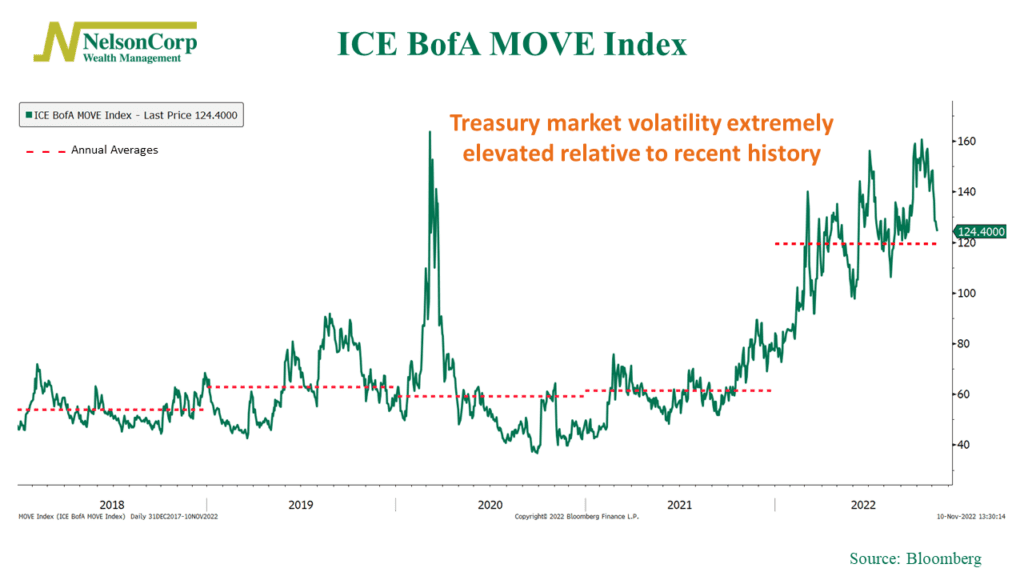
This week’s featured chart is the ICE BofA MOVE Index, a well-known measure of U.S. interest rate volatility.
Specifically, the MOVE Index calculates future volatility in U.S. Treasury yields implied by prices of one-month options on Treasuries of various maturities, ranging from 2 years to 30 years. More simply, it can be thought of as the cost to insure against outsized interest rate moves in the Treasury market, either upward or downward.
Basically, it’s like the VIX for bonds. Whereas the VIX Index measures implied volatility in the stock market, the MOVE Index measures implied volatility in the bond market.
What our chart above shows is that Treasury bond market volatility—as measured by the MOVE Index—has been extremely elevated this year. The current readings are hovering near the March 2020 highs. And as the red dashed lines show, the annual average reading for this year is drastically higher than it has been in recent years.
The reason for this is mainly due to Fed policy. The Fed has ratcheted up the federal funds rate quickly this year, and that rapid pace has left markets with little to no time to adjust expectations. This has been a significant headwind for both stocks and bond prices. We will watch for a drop in the MOVE Index, as that should produce a better environment for both stock and bond returns.
This is intended for informational purposes only and should not be used as the primary basis for an investment decision. Consult an advisor for your personal situation.
Indices mentioned are unmanaged, do not incur fees, and cannot be invested into directly.
Past performance does not guarantee future results.