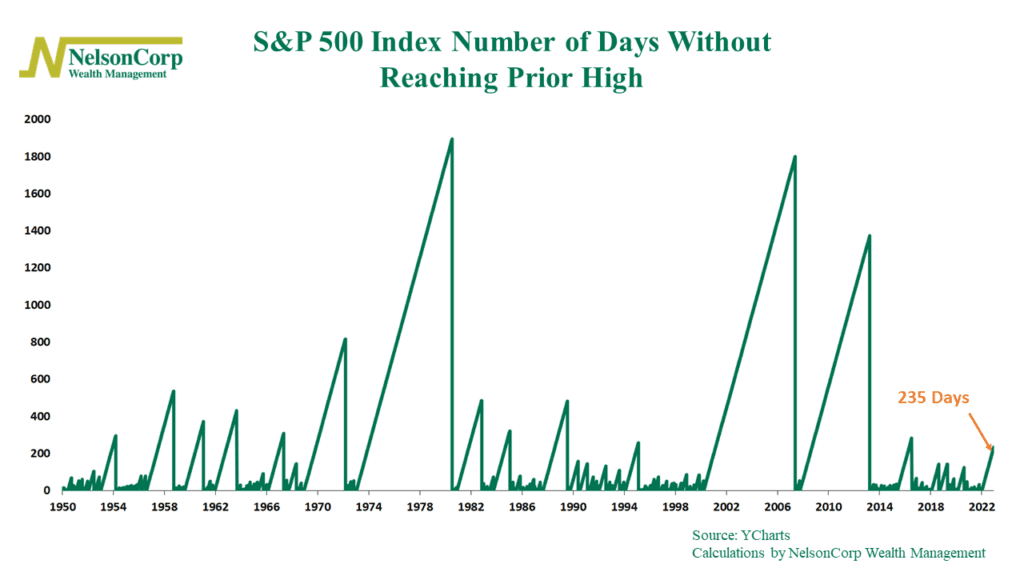
The S&P 500 Index is a popular stock market index often used to measure the overall health of the U.S. stock market. One way to gauge the strength of the market is to look at the number of days the index spends below its prior high.
As I’ve pointed out on our featured chart above, the S&P 500 has gone 235 days without returning to its prior high. This feels like a long time—and it is—but when we look at the full history of the index, it hasn’t yet come close to many of the other bear markets in the past. Even the streak in 2016, at 285 days, was longer than the current one.
The takeaway? If this bear market is going to end up being as drawn out as many of the other significant downturns we’ve experienced in the past, then it’s likely we will have more time to wait before seeing the S&P 500 return to new highs anytime soon.
This is intended for informational purposes only and should not be used as the primary basis for an investment decision. Consult an advisor for your personal situation.
Indices mentioned are unmanaged, do not incur fees, and cannot be invested into directly.
Past performance does not guarantee future results.