Relative strength is a powerful tool used to model stock market risk. It measures the performance of a security or group of securities to another group of securities to determine outperformance.
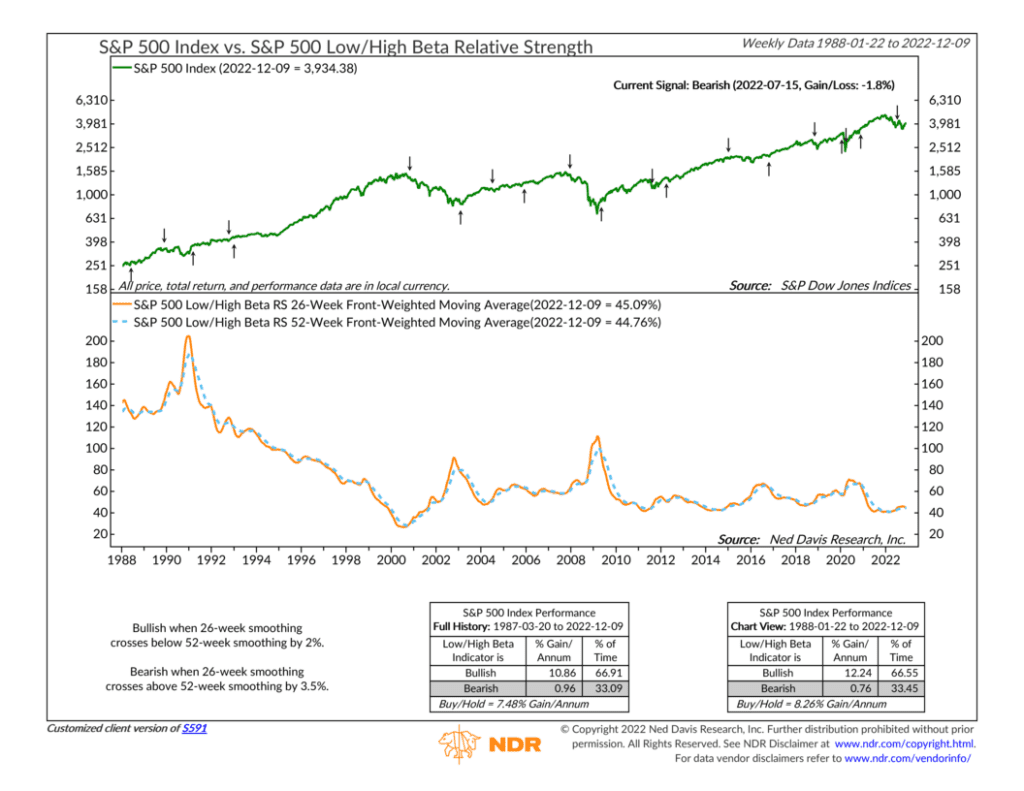
For example, we like to look at the relative strength of low and high beta stocks, shown on the featured indicator above.
Beta is a measure of a stock’s volatility, and low beta stocks are those that are less volatile than the overall market, while high beta stocks are those that are more volatile. By dividing low beta stocks by high beta stocks, we get a ratio that rises when low beta stocks are doing better and falls when high beta stocks outperform.
This dynamic captures both investor sentiment and relative momentum. When high beta stocks are outperforming, it’s a sign that risk appetites are high, and volatile stocks that tend to lead the broader market do well. However, when low beta stocks outperform, it’s a sign of decreased risk appetites and better performance for less volatile stocks. Because of this, the relative performance of low beta to high beta stocks is an excellent leading indicator for the market.
Specifically, the indicator above takes the 26-week front-weighted moving average of the low-to-high-beta ratio (orange line). This gets compared to the longer 52-week front-weighted moving average (blue dashed line) to determine buy and sell signals for the S&P 500 (green line, top clip).
How’s the performance? When the 26-week moving average crosses below the 52-week moving average by at least 2%, it triggers a buy signal that has historically led to a 10%+ gain per year in the S&P 500. However, when the 26-week moving average crosses above the 52-week moving average by at least 3.5%, a sell signal is triggered, leading to annualized returns of less than 1% in the S&P 500.
With data going back to the 1980s, you can see on the chart how the low/high beta relative strength line tends to increase during bear markets—meaning low beta stocks are outperforming—and decrease during bull markets when high beta stocks shine. This makes it a valuable tool for measuring stock market risk.
The bottom line? Beta matters. By analyzing the relative strength of low beta and high beta stocks within the S&P 500, investors can glean valuable insights into the stock market’s overall performance and use that information to make more informed decisions about their investment strategies.
This is intended for informational purposes only and should not be used as the primary basis for an investment decision. Consult an advisor for your personal situation.
Indices mentioned are unmanaged, do not incur fees, and cannot be invested into directly.
Past performance does not guarantee future results.
