For this week’s featured indicator, we explore the Purchasing Managers’ Index (PMI) and how it can be used to determine trends in the stock market.
But first, what is the Purchasing Managers’ Index? Essentially, it’s a measure of the strength of the economy. Specifically, it consists of two separate indexes—one for the manufacturing sector and the other for the service sector. These indices are based on a monthly survey of supply chain managers (called purchasing managers) in which they give their view on whether their industry is expanding, staying the same, or contracting. When combined into one index, the PMI makes for a useful leading indicator of the economy.
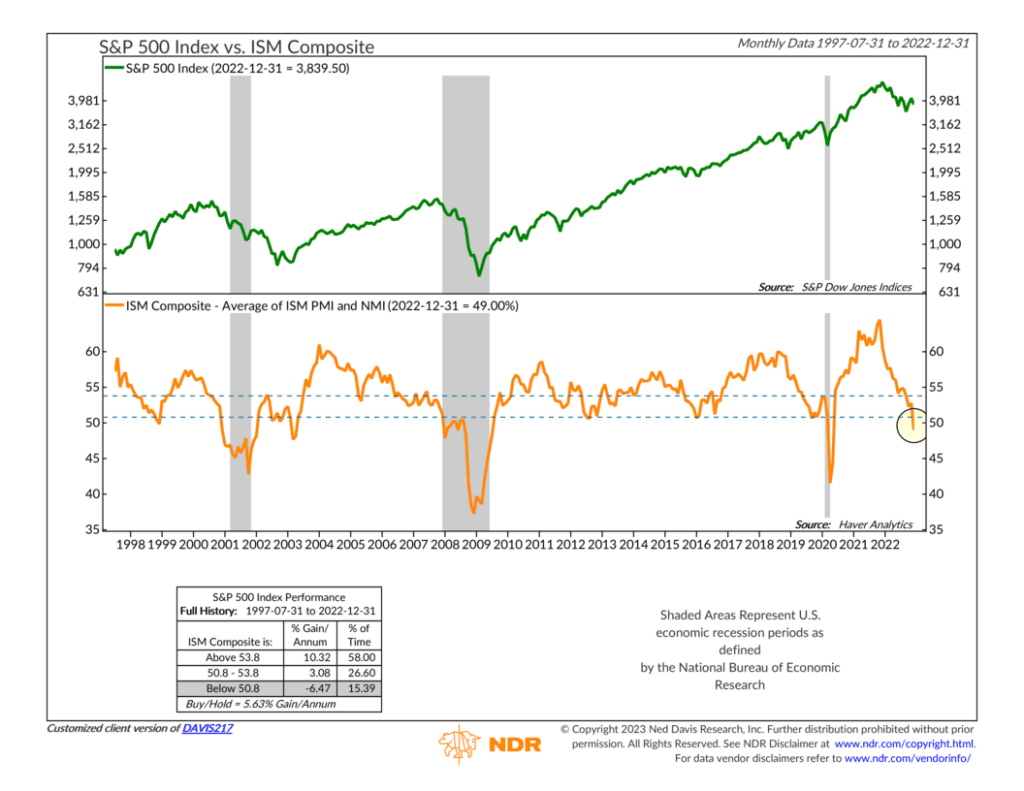
The S&P 500 index of large-cap stocks is shown as the green line on the chart above, and below it, we have the average reading of the manufacturing and service PMIs. Historically, the S&P 500 has shown the highest growth rate (about 10.4% per annum) when the average PMI reading is above a reading of roughly 53.8 (as denoted by the upper dashed line). Between the dashed lines, the S&P 500 has grown slower (about 3% per annum). And when the average PMI falls below 50.8, the stock market has actually contracted by a rate of about -6.5% per annum.
Why is this the case? Well, I’ve also added grey-shaded areas to the chart to show recession periods. As you can see, the PMIs tend to fall into the contraction zone around the same time the economy tends to go into recession. This is a sign that the PMI does a decent job of tracking the economy’s strength (or lack thereof). This is important because downturns in economic activity tend to be bad for corporate profits and, in turn, stock prices.
What is the PMI saying now? I highlighted the current level on the chart. Last month’s reading fell to 49%, the contractionary zone for the indicator. It will be worth watching this in the months ahead as more deterioration from here would further increase the odds that the U.S. economy falls into a recession.
All of this is important because whether or not we see another leg lower in the stock market will likely come down to how well the economy holds up in the months ahead.
This is intended for informational purposes only and should not be used as the primary basis for an investment decision. Consult an advisor for your personal situation.
Indices mentioned are unmanaged, do not incur fees, and cannot be invested into directly.
Past performance does not guarantee future results.
