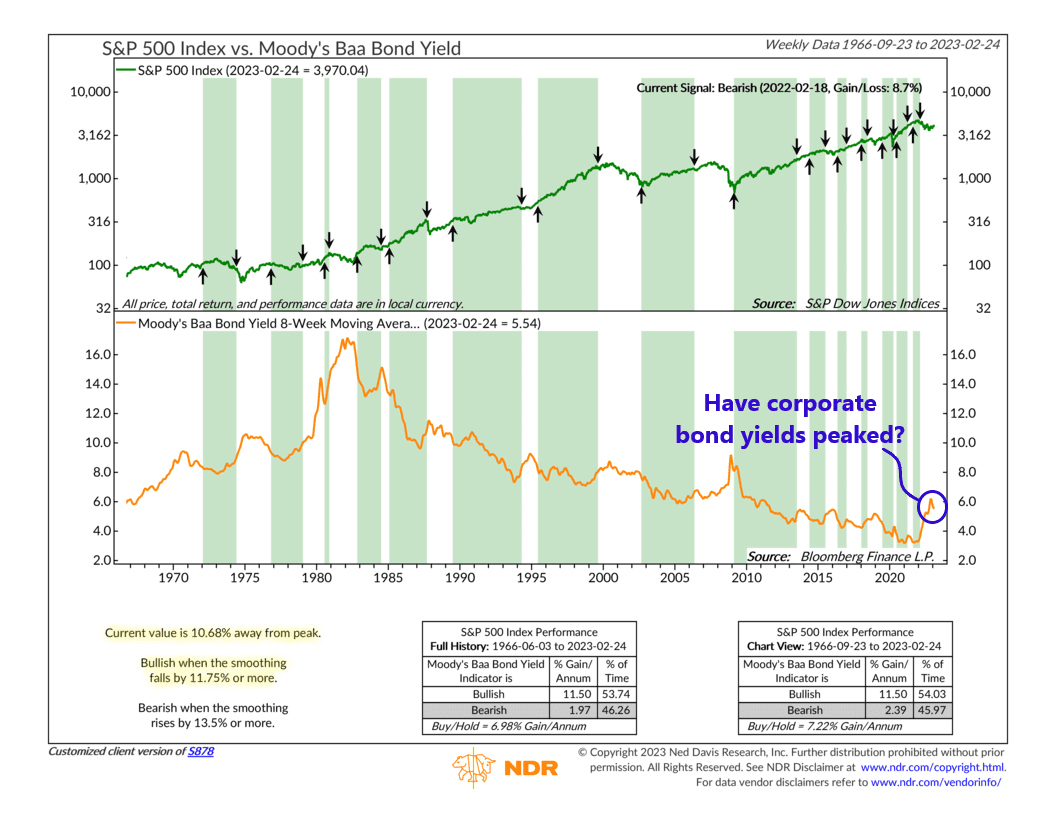
This week’s featured indicator is based on the concept that reversals in bond yields (interest rates) often call the tune of the stock market.
Why? Because bond yields compete with stock dividends for investors’ money. Additionally, interest rates affect the cost of financing business growth and profitability. Because of this, falling bond yields have historically been favorable for stock prices, whereas rising rates are less favorable.
On the top clip of the chart above, we have the S&P 500 Index—a representation of the 500 largest stocks in the U.S. market. The bottom clip shows the 8-day moving average of Moody’s Baa bond yields. We use Moody’s Baa bond yields because it signifies medium-quality corporate bond yields, which are representative of a typical large corporation’s long-term borrowing costs.
The indicator turns bullish when the smoothed bond yield falls by 11.75% or more from a previous peak and turns bearish when it rises by 13.5% or more from a prior bottom. The areas shaded in green indicate bullish periods, whereas the unshaded areas show bearish periods. The mode boxes on the bottom of the chart show the annualized returns of the S&P 500 based on the indicator’s reading.
Since 1966, bullish periods have coincided with S&P 500 returns of 11.5% annually, whereas bearish periods have corresponded with S&P 500 returns of roughly 2% annually. The two periods occur approximately an equal amount of time, with bullish periods occurring more frequently.
During previous market crises—like the early 2000s and 2008—you can see how the indicator tends to trigger bullish signals near the bottom of stock market selloffs. This makes sense because an 11.75% or greater fall in corporate bond yields (the bullish criteria for the indicator) only tends to occur when fear has subsided, and investors are warming up to risk again.
This brings us to recent history. The indicator turned bearish a year ago when corporate bond yields rose more than 13.5% from their record-low levels. This was a sign of “risk-off” attitudes in the market, and stocks have declined roughly 9% since then.
Currently, however, it looks like the indicator may have peaked. The current value is about 10.68% off the November peak. A roughly 1% fall in yields from here would give the green light for the S&P 500.
The bottom line? Corporate bond yields matter to the stock market. An environment where corporate borrowing costs are rising is not an environment that is conducive to strong stock market returns. When borrowing costs are falling, however, stocks perform much better.
This is intended for informational purposes only and should not be used as the primary basis for an investment decision. Consult an advisor for your personal situation.
Indices mentioned are unmanaged, do not incur fees, and cannot be invested into directly.
Past performance does not guarantee future results.
