This week’s featured indicator focuses on breadth, or participation, in global financial markets.
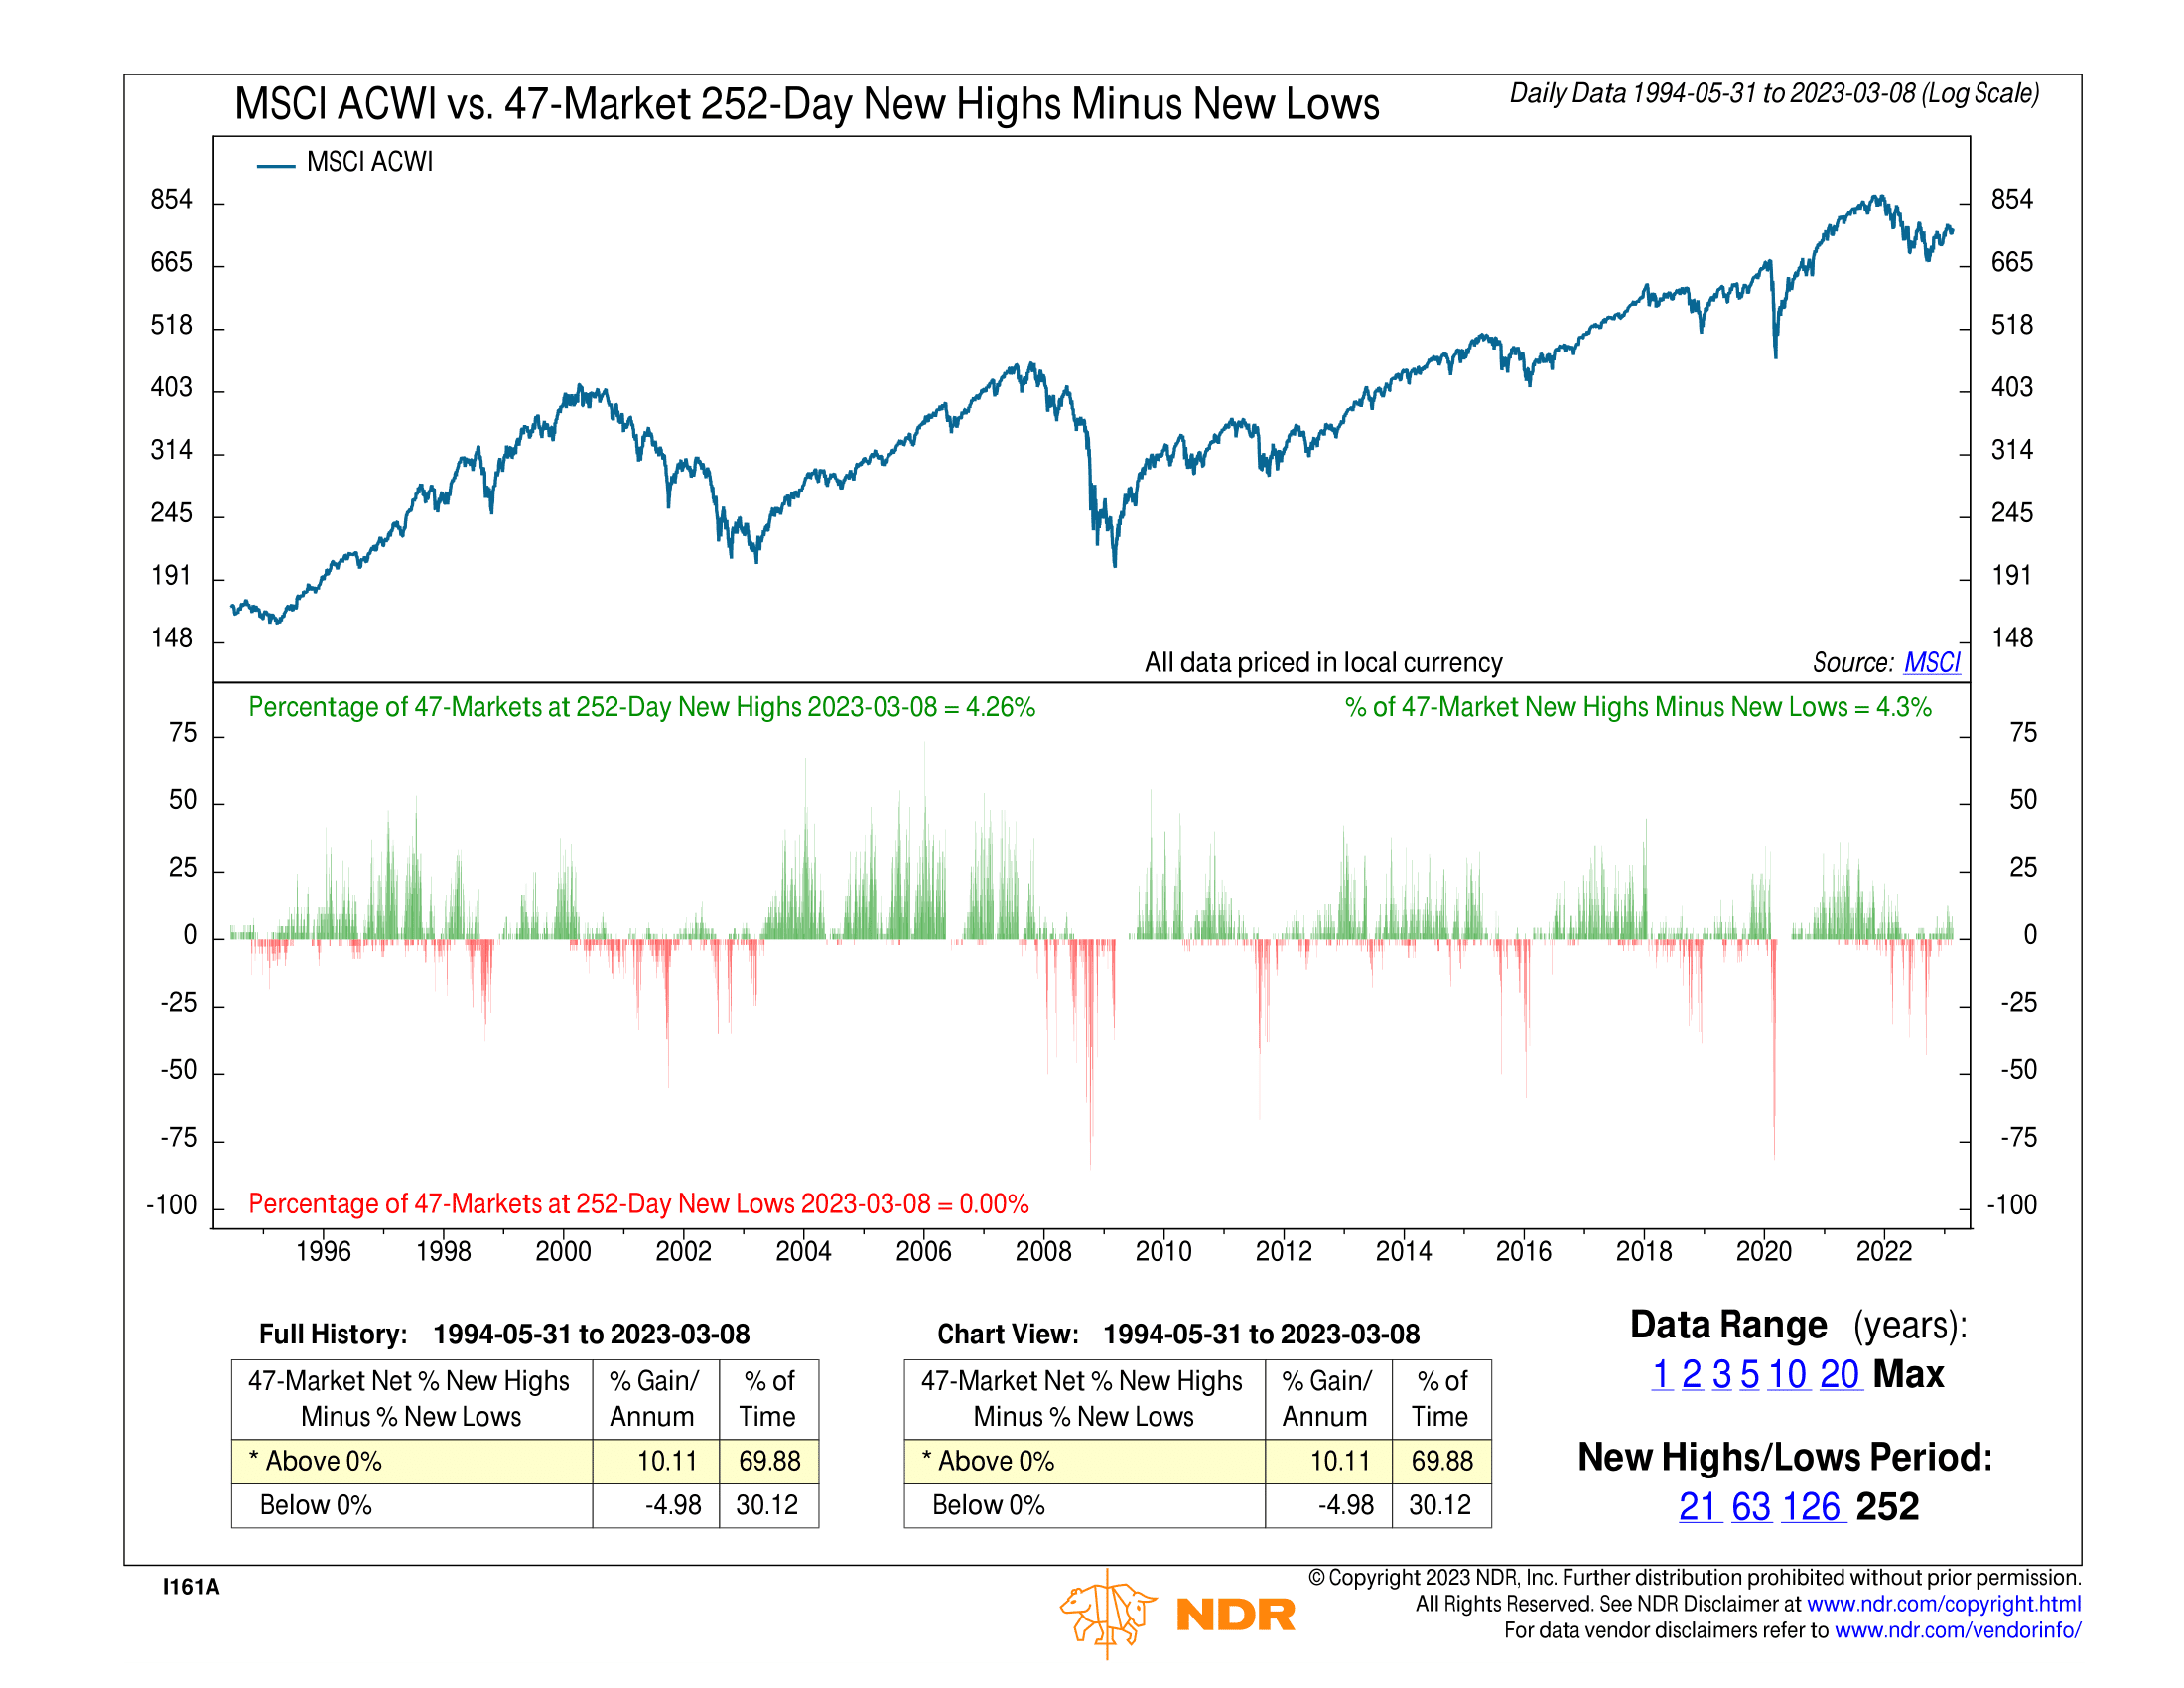
On the top half of the graph, we have the MSCI All-Country World Index, a benchmark index for the global stock market performance.
On the bottom half of the graph, we show the spread between the percentages of 47 markets within the index that are trading at one-year highs and one-year lows.
In other words, let’s say 10% of the 47 global stock markets are trading at one-year highs, but just 5% of them are trading at one-year lows. Then the spread or difference between the two would be 5%, which would show up as a positive (green) reading on the chart.
Historically, as the performance boxes on the bottom of the chart reveal, global stocks tend to return more than 10% per year when the spread between the 47 markets at new highs and lows is greater than zero (positive). But when that spread is below zero (negative), global stocks have a -5% annualized return.
This probably isn’t all that surprising of a finding. It makes sense. The more stock markets around the world that are trading at new highs relative to the ones trading at new lows, the better the market’s average return should be. And the historical record of this indicator backs up the idea that momentum matters to the stock market—particularly if that momentum is broad-based.
The implication today, according to this indicator, is that stock market momentum is finally picking up steam around the globe. After a year of more markets hitting one-year lows versus highs—and the poor global stock returns that came with that—the spread is finally in positive territory again. It would be an encouraging sign for stocks globally if this can hold.
This is intended for informational purposes only and should not be used as the primary basis for an investment decision. Consult an advisor for your personal situation.
Indices mentioned are unmanaged, do not incur fees, and cannot be invested into directly.
Past performance does not guarantee future results.