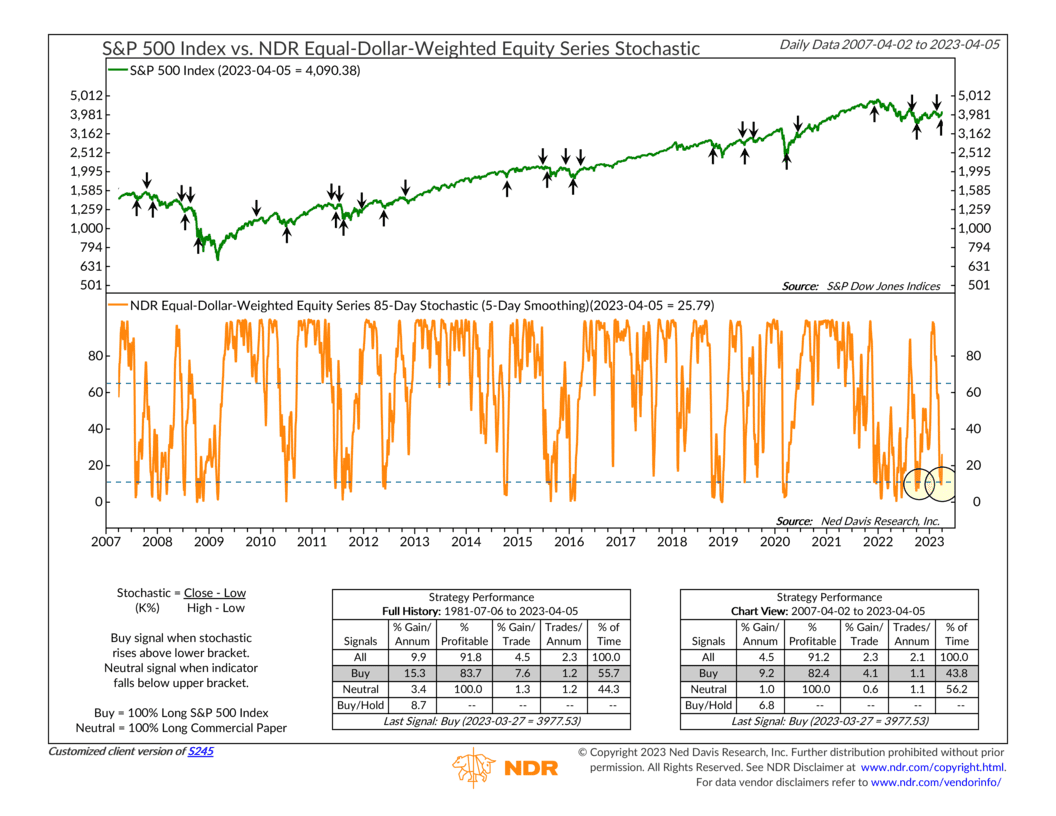
A stochastic indicator is an important technical tool that we use to gauge the stock market’s strength. Unlike some other indicators that use inputs like corporate profits or economic data, a stochastic looks at just the price movement of the stock market itself. Hence, we call it a “price-based” or “internal” indicator, and it does an exceptionally good job of measuring stock price momentum.
The stochastic indicator is particularly good at using momentum to identify potential market turning points or reversals. This is because the indicator determines if stocks have been closing near the top or bottom of their price range—which, in this case, is 85 days or about four months—and looks for reversals from those highs or lows.
The primary calculation of the stochastic indicator is what its inventor George Lane called the %K. The %K takes the latest close of a stock market index over the past 85 days, subtracts out the lowest low over that same period, and then divides that spread by the range over the past 85 days (highest high minus the highest low). The result is then multiplied by 100 and smoothed using a 5-day simple moving average.
Analysis reveals that the best buy signals are generated when this indicator rises above the lower bracket on the chart, indicating that, after closing near the bottom of its 85-day range, the market has started to move higher. And by that same logic, the most effective sell signals have come when the indicator falls below the upper bracket, a sign that the market is starting to move lower after closing near the high of its 85-day range. (Neutral signals are generated if the indicator reverses across a bracket after falling/rising above it).
The strategy has a pretty good track record going back 40+ years. The stock market’s performance after buy signals has roughly doubled that of a buy-and-hold approach, whereas sell and neutral signals have coincided with below-average returns.
The indicator generated a buy signal last October and another just this past week. Taken together, this is likely a strong signal that the market is trying to move higher and build momentum whenever it reaches the low end of its 4-month range.
Overall, we’d say that the historical track record of the stochastic indicator makes it a fairly reliable price-based indicator that helps ensure that we stay on the right side of “the trend” and don’t get caught off guard by the market’s internal movements.
This is intended for informational purposes only and should not be used as the primary basis for an investment decision. Consult an advisor for your personal situation.
Indices mentioned are unmanaged, do not incur fees, and cannot be invested into directly.
Past performance does not guarantee future results.
