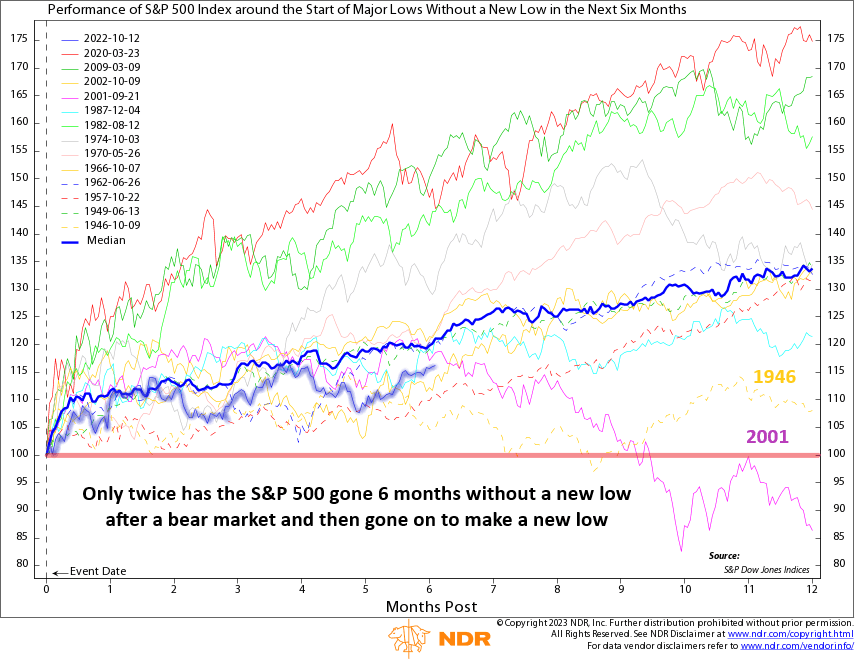
This week, we have a fun little chart showing how the S&P 500 stock index has performed after going six months without a new 52-week low after entering a bear market. Each date on the chart represents the lowest point of significant declines of 20% or more, where the S&P 500 did not reach a new low for at least the next six months from that point. The lines on the chart represent the percentage change in the 12 months following this low point.
Throughout history, there have been a total of 14 instances, including the current one, where this pattern has occurred. However, as the chart indicates, there have been only two occasions when the market went on to make new lows after six months, which were in 1946 and 2001. In 1946, the S&P 500 reached a new low (falling below the red line) just before the 9-month mark, and in 2001, it made a new low around the 10-month mark. On the other hand, in the remaining 11 instances, the market experienced gains, sometimes even substantial gains. The median return for the S&P 500 during these instances, as shown by the dark blue line, has been notably strong.
The current instance is highlighted in blue on the chart, revealing that six months later, the S&P 500 has risen approximately 15% from the October 2022 low. This historical data suggests that it would be rare for the market to make new lows from this point onward, although not impossible.
This is intended for informational purposes only and should not be used as the primary basis for an investment decision. Consult an advisor for your personal situation.
Indices mentioned are unmanaged, do not incur fees, and cannot be invested into directly.
Past performance does not guarantee future results.
