A lot of investing success comes from being able to stay on the right side of a trending market. This principle is encapsulated by the industry phrase “Keep the trend your friend.” In other words, it’s not a good idea to fight your friend, and it’s not a good idea to fight a trending market, either.
But here’s the thing. Occasionally, various sectors or fragments of the market go their own way, which can lead to a distorted interpretation of the market’s primary trend. Nevertheless, we can generate a more dependable signal if we can accurately evaluate the collective majority.
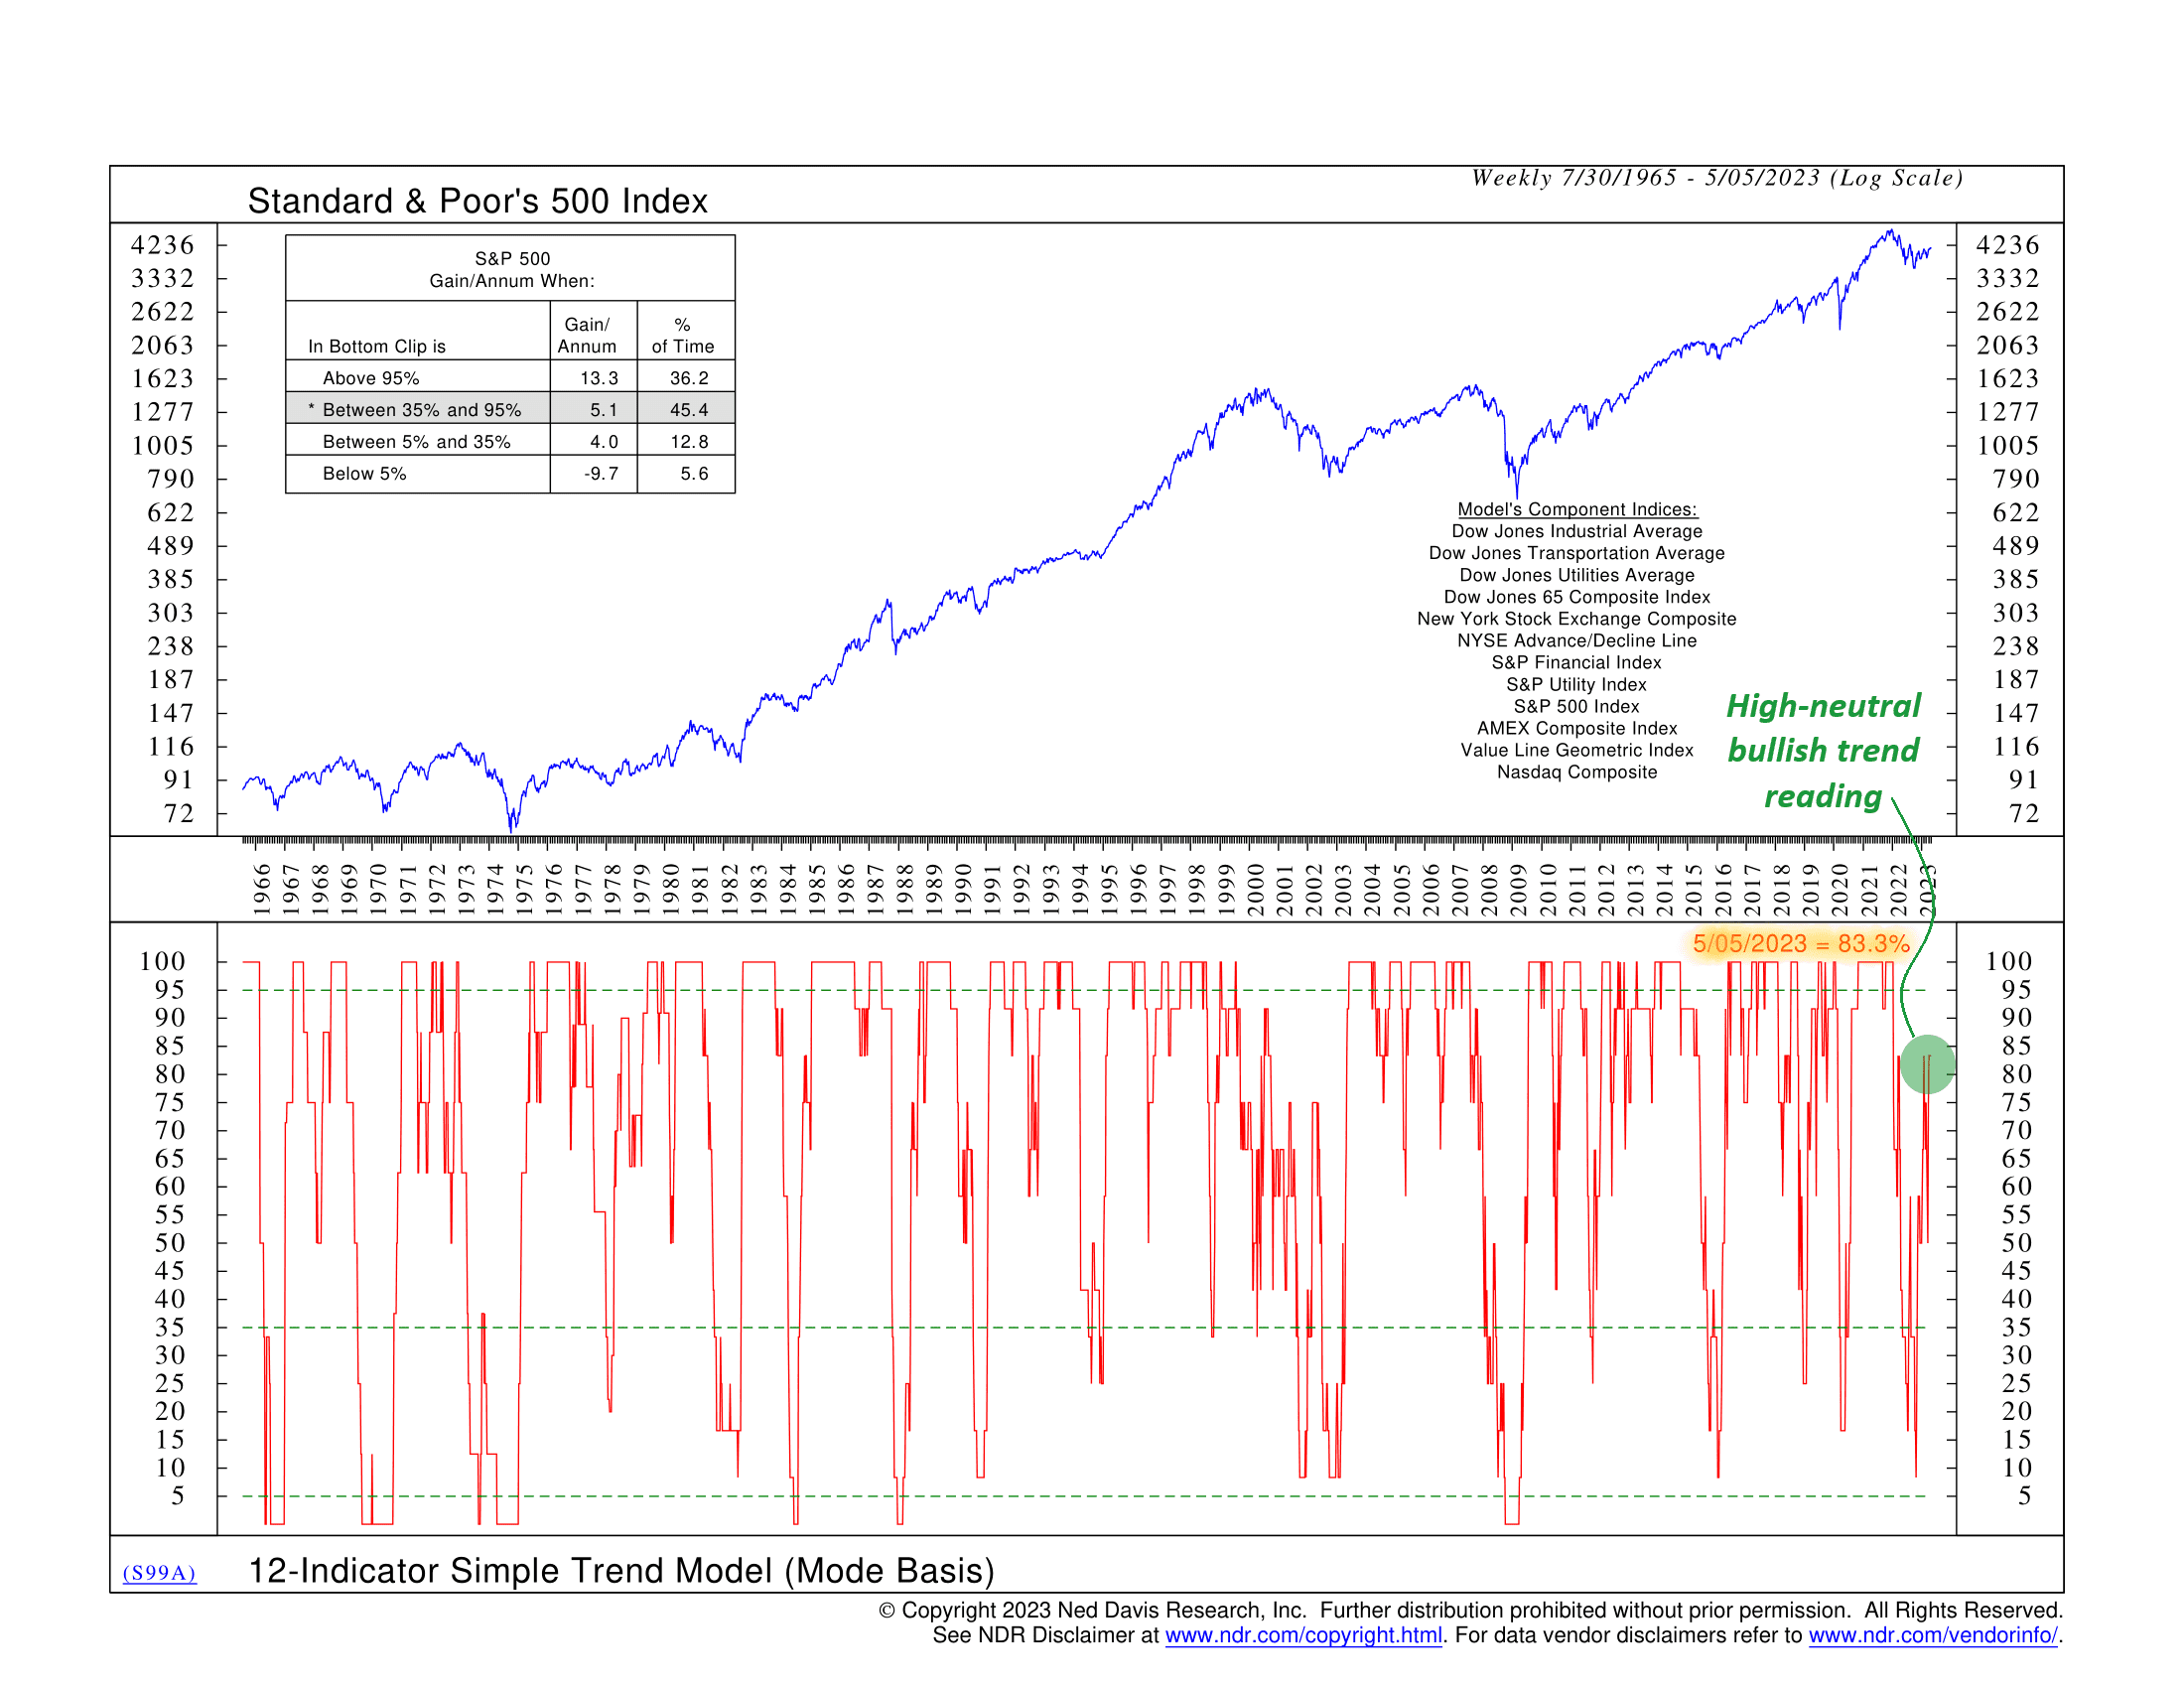
For instance, the indicator above examines 12 financial indices and assesses their trends using a set of optimized moving averages. The chart displays the list of these 12 indices, encompassing broad-based indices as well as more specific ones such as utilities, financials, and breadth measurements. The indicator combines the readings from these indices into a single measure, ranging from 0% to 100%, depicted as the red line at the bottom of the chart. A reading of 100% suggests a bullish stance across all indicators, while 0% indicates bearishness across the board.
The indicator utilizes weekly data dating back to 1965 for all 12 indices, including the S&P 500 index (represented by the blue line at the top), which serves as a historical benchmark for evaluating the indicator’s performance. The performance box reveals that the most bullish scenario for the S&P 500 occurs when more than 95% of the indices exhibit bullish trends. In the range between 5% and 95%, the S&P 500 tends to generate more average returns, around 4% or 5% per annum. And when less than 5% of the indices are bullish, the S&P 500 experiences negative annual returns.
As of 5/5/2023, the current reading stands at approximately 83%. Although not outright bullish, this falls within the high-neutral zone, representing a substantial improvement compared to the low of less than 10% reached last year.
The bottom line? It appears that the trend continues to improve. This particular indicator spends approximately 45% of its time within the range of a 35% to 95% reading, during which the S&P 500 records an average annual gain of 5%. Therefore, this range is considered favorable for stockholders. However, we should keep an eye out for the indicator surpassing the 95% threshold, as that is when the trend transitions from being a friend to becoming a best friend.
This is intended for informational purposes only and should not be used as the primary basis for an investment decision. Consult an advisor for your personal situation.
Indices mentioned are unmanaged, do not incur fees, and cannot be invested into directly.
Past performance does not guarantee future results.
