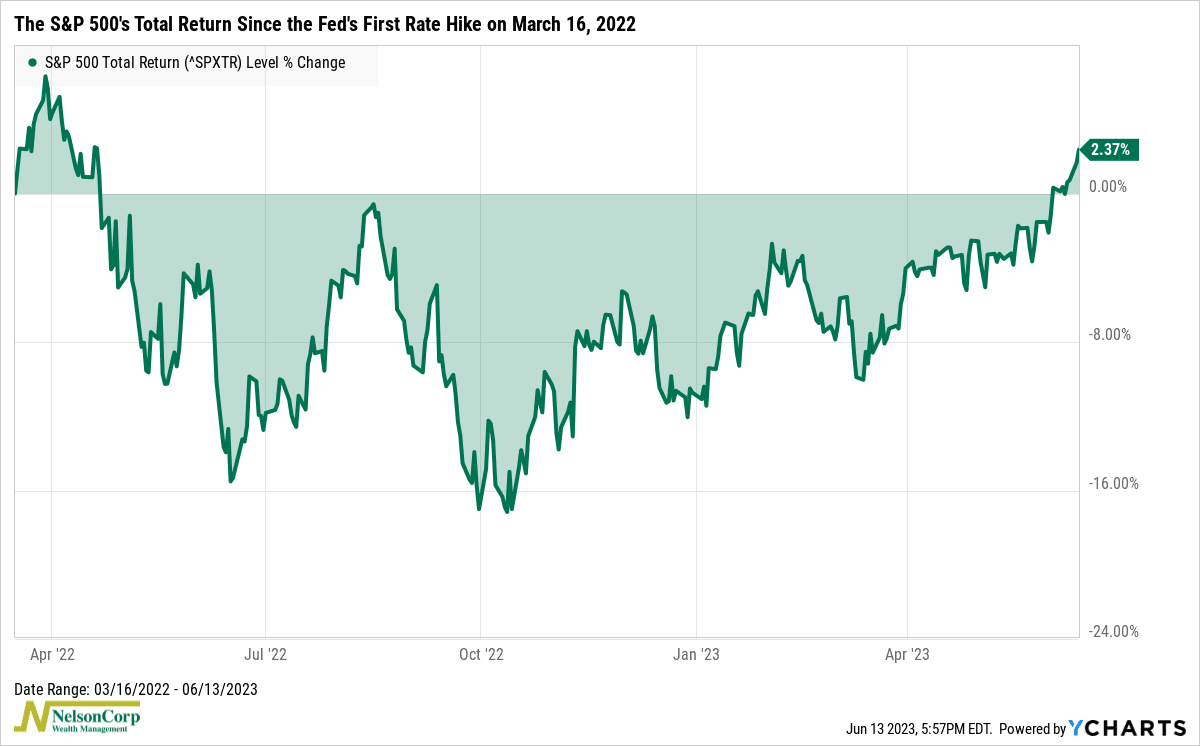
The stock market has been on quite the roller coaster ride since the Fed first started hiking rates last year to fight inflation. But, as our featured chart this week shows, the S&P 500 is finally back in the black for the first time since it originally went negative after Powell first announced a rate hike on March 16th, 2022.
Let’s delve into the numbers. Last year, the S&P 500 experienced a peak-to-trough decline of approximately 25%, with 17% of that drop occurring after the first rate hike on March 16th. Since reaching its low point on October 12th, however, the S&P 500 has increased nearly 24%. Furthermore, since the first rate hike announcement on March 16th, the S&P 500 is now up a few percentage points, as depicted in the chart above.
What can we gather from this information? It seems that the stock market has likely moved past the period of aggressive Fed rate hikes. Now, this doesn’t mean that investors are no longer concerned about the Federal Reserve or inflation, nor does it guarantee that the stock market won’t experience further declines. It certainly could. But it appears that the market has already factored in much of the risk, indicating that investors may now be turning their attention to what lies ahead.
This is intended for informational purposes only and should not be used as the primary basis for an investment decision. Consult an advisor for your personal situation.
Indices mentioned are unmanaged, do not incur fees, and cannot be invested into directly.
Past performance does not guarantee future results.
