This week I want to introduce a technical indicator called a moving average cross. The basic idea is that you take two moving averages—one shorter-term and the other longer-term—and generate buy/sell signals for an asset based on whether the shorter-term moving average crosses above/below the longer-term moving average.
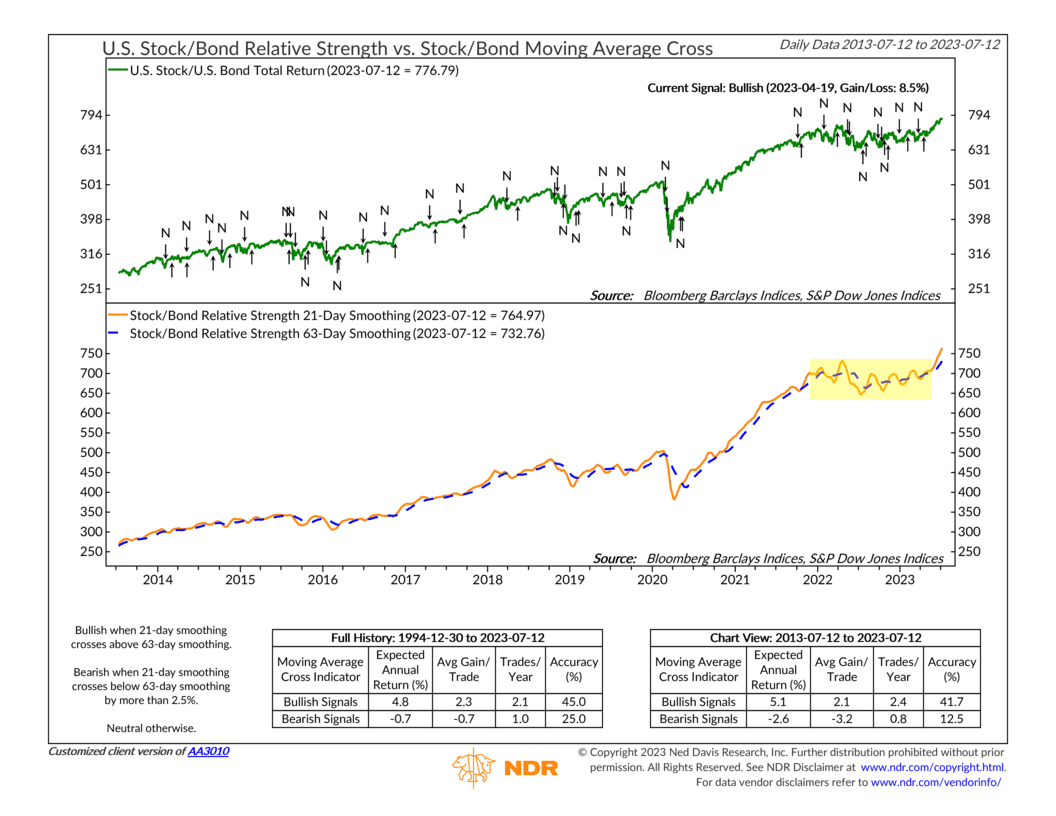
For this specific indicator, we are using the U.S. stock/bond ratio (green line, top clip) as the asset we want to model. When this ratio is rising, it simply means that stocks are outperforming bonds on a total return basis; when the ratio is falling, it means bonds are outperforming stocks.
To produce our indicator, we plot the 21-day moving average of the stock/bond ratio, shown as the orange line on the bottom clip of the chart. That’s the short-term moving average. The long-term moving average (blue dashed line) is calculated over 63 days.
The rules of indicator say that when the 21-day moving average crosses above the 63-day moving average, it generates a buy signal for the stock/bond ratio. And by contrast, when the 21-day moving average crosses below the 63-day moving average, it generates a sell signal.
In other words, when short-term momentum is outpacing long-term momentum, it’s bullish for the asset in question, and vice versa. That’s it. Pretty simple, but it makes sense. If you want to stay on the right side of a trending market, this is a valuable tool to have in your toolbox.
As for the performance numbers, going back to 1994, bullish signals have generated average annualized returns of roughly 4.8% for the stock/bond ratio, whereas bearish signals have produced -0.7% annualized returns. (To be sure, those return numbers are for a ratio, which makes it less intuitive, but directionally you can see the point).
What’s the indicator telling us now? Well, as I’ve highlighted on the chart, the indicator was moving sideways for about the past year and a half, meaning neither stocks nor bonds were particularly strong relative to the other.
But in April, the indicator generated a buy signal with some staying power. The indicator broke above its trading range, indicating that stocks had finally gotten the upper hand on bonds. Since that signal, the stock/bond ratio has gained roughly 8.5%—meaning stocks have outperformed bonds by quite a bit more than the historical average for a buy signal.
It remains to be seen whether this will continue to be true. But as long as the short-term trend remains higher than the long-term trend, it indicates that stocks are outperforming bonds as an asset class.
This is intended for informational purposes only and should not be used as the primary basis for an investment decision. Consult an advisor for your personal situation.
Indices mentioned are unmanaged, do not incur fees, and cannot be invested into directly.
Past performance does not guarantee future results.
