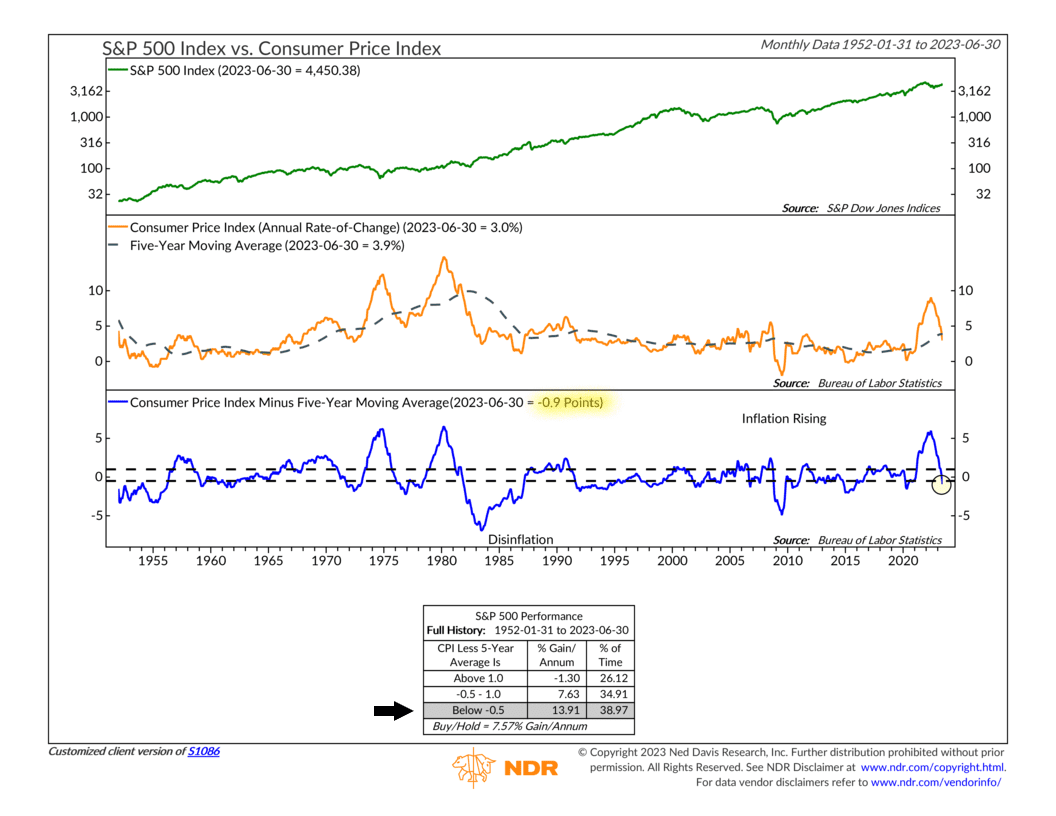
The big economic news this week was the release of the Consumer Price Index (CPI) on Wednesday—and it was a good one. On a year-over-year basis, the headline CPI eased to 3.0% last month, the slowest pace since March 2021.
This was a pivotal development for the stock market, as it means one of our key inflation indicators has now turned positive.
The chart above plots the current CPI rate (orange line, middle clip) relative to its 5-year average (black dashed line, middle clip) to determine when inflation is a positive/negative influence on stock prices. The difference between the two is shown as the blue line on the bottom clip of the chart.
With the CPI currently at 3% and the 5-year average now at 3.9%, that means the difference is -0.9 percentage points. This brought the indicator down into the bullish “disinflation” zone on the chart, where the S&P 500 index (green line, top clip) has historically returned nearly 14% per year, on average.
To be fair, inflation is still above the Fed’s 2% target rate, so we will likely see the Fed deliver another 25 basis point increase at their next meeting this month. But, all else equal, the fact that our inflation indicators are turning bullish is a promising development.
This is intended for informational purposes only and should not be used as the primary basis for an investment decision. Consult an advisor for your personal situation.
Indices mentioned are unmanaged, do not incur fees, and cannot be invested into directly.
Past performance does not guarantee future results.
