It’s been pretty quiet in the stock market lately. Since about mid-March, or 100 trading days ago, the S&P 500 Index has been moving steadily higher without much fanfare.
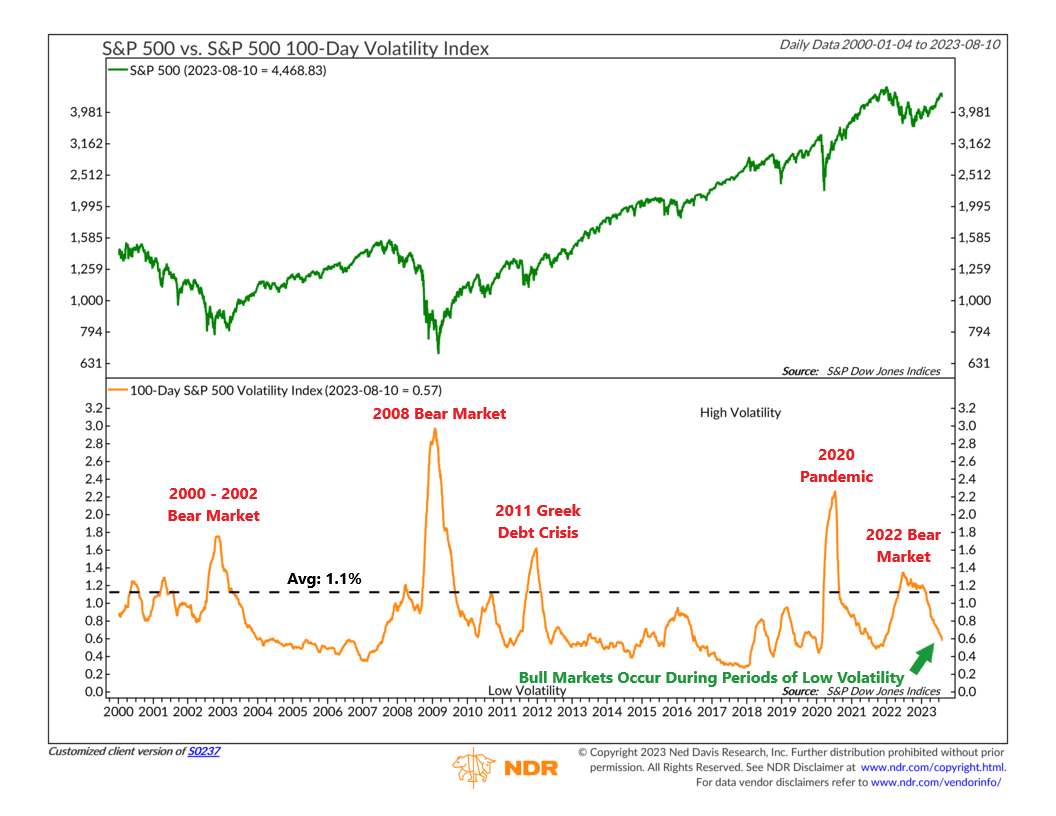
Our featured chart above illustrates just how quiet this move has been. The chart’s top clip plots the daily closing value of the S&P 500 Index. And on the bottom clip, the orange line shows the average daily percentage move of the S&P 500 over the past 100 trading days. In other words, it reflects how much the stock market has typically moved on a 1-day basis over any given 100 days in the last 23 years.
As you can see, the current reading is just 0.57%. That’s pretty low. Much lower than the average 1.1% change from one day to the next that the S&P 500 typically exhibits.
But that’s good news. As I’ve highlighted on the chart, nasty downturns or bear markets have generally occurred when the 100-day realized volatility of the S&P 500 is above average (above 1.1%).
Bull markets, on the other hand, tend to exhibit below-average volatility. And with a realized volatility reading of just 0.57% currently, that means we are solidly in bull market territory.
The takeaway? Rising prices and declining volatility define a bull market. The fact that we see both of those right now is a positive sign for the stock market.
This is intended for informational purposes only and should not be used as the primary basis for an investment decision. Consult an advisor for your personal situation.
Indices mentioned are unmanaged, do not incur fees, and cannot be invested into directly.
Past performance does not guarantee future results.
