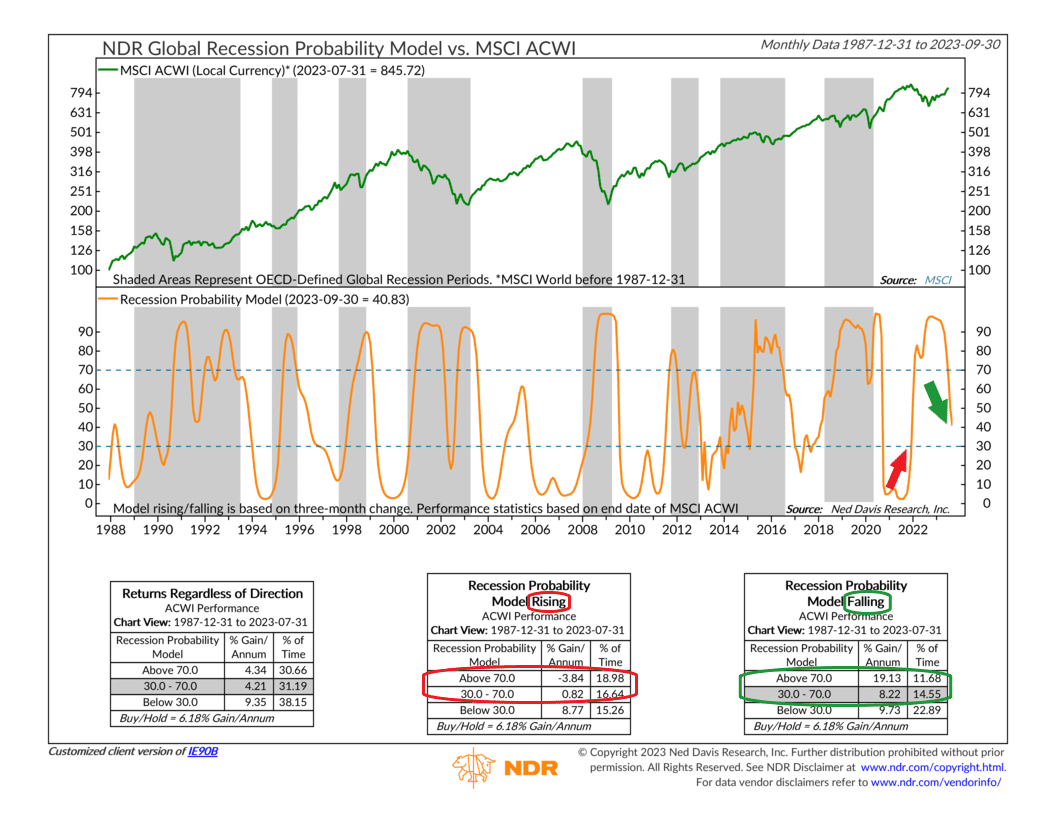
This week’s indicator is called the Global Recession Probability Model. It uses a statistical technique called “logistic regression” to identify when global economic growth might slow down, with the probability ranging from 0% to 100%.
We talked about this indicator last February. At that time, the model had risen to over 70%, a sign that there was a high percentage chance that global growth was going to slow. That also meant that global stocks might struggle, too—which they did.
As highlighted on the chart, the model broke above 30% on 1/31/2022, correctly signaling that global growth was slowing. Historically, the stock market has performed the worst when the model is rising, with the returns getting progressively worse as the model goes from below 30% to between 30% and 70%, and finally above 70%. Returns have been negative when above 70%, and that’s precisely what we got in 2022.
However, the model peaked in October 2022, the same month that the stock market bottomed out. Historically, when the model declines from a peak above 70%, as it is now, global stocks tend to do well.
Global stocks have indeed been performing well this year, with the MSCI All-Country World Index returning nearly 13% so far this year. With the Global Recession Probability model at just 41% currently and falling, it’s a sign that we might be able to avoid a global recession—which would be a good thing for stocks. A reversal higher in the model would indicate economic growth is stalling again—which is something to keep an eye on—but so far, so good.
This is intended for informational purposes only and should not be used as the primary basis for an investment decision. Consult an advisor for your personal situation.
Indices mentioned are unmanaged, do not incur fees, and cannot be invested into directly.
Past performance does not guarantee future results.
