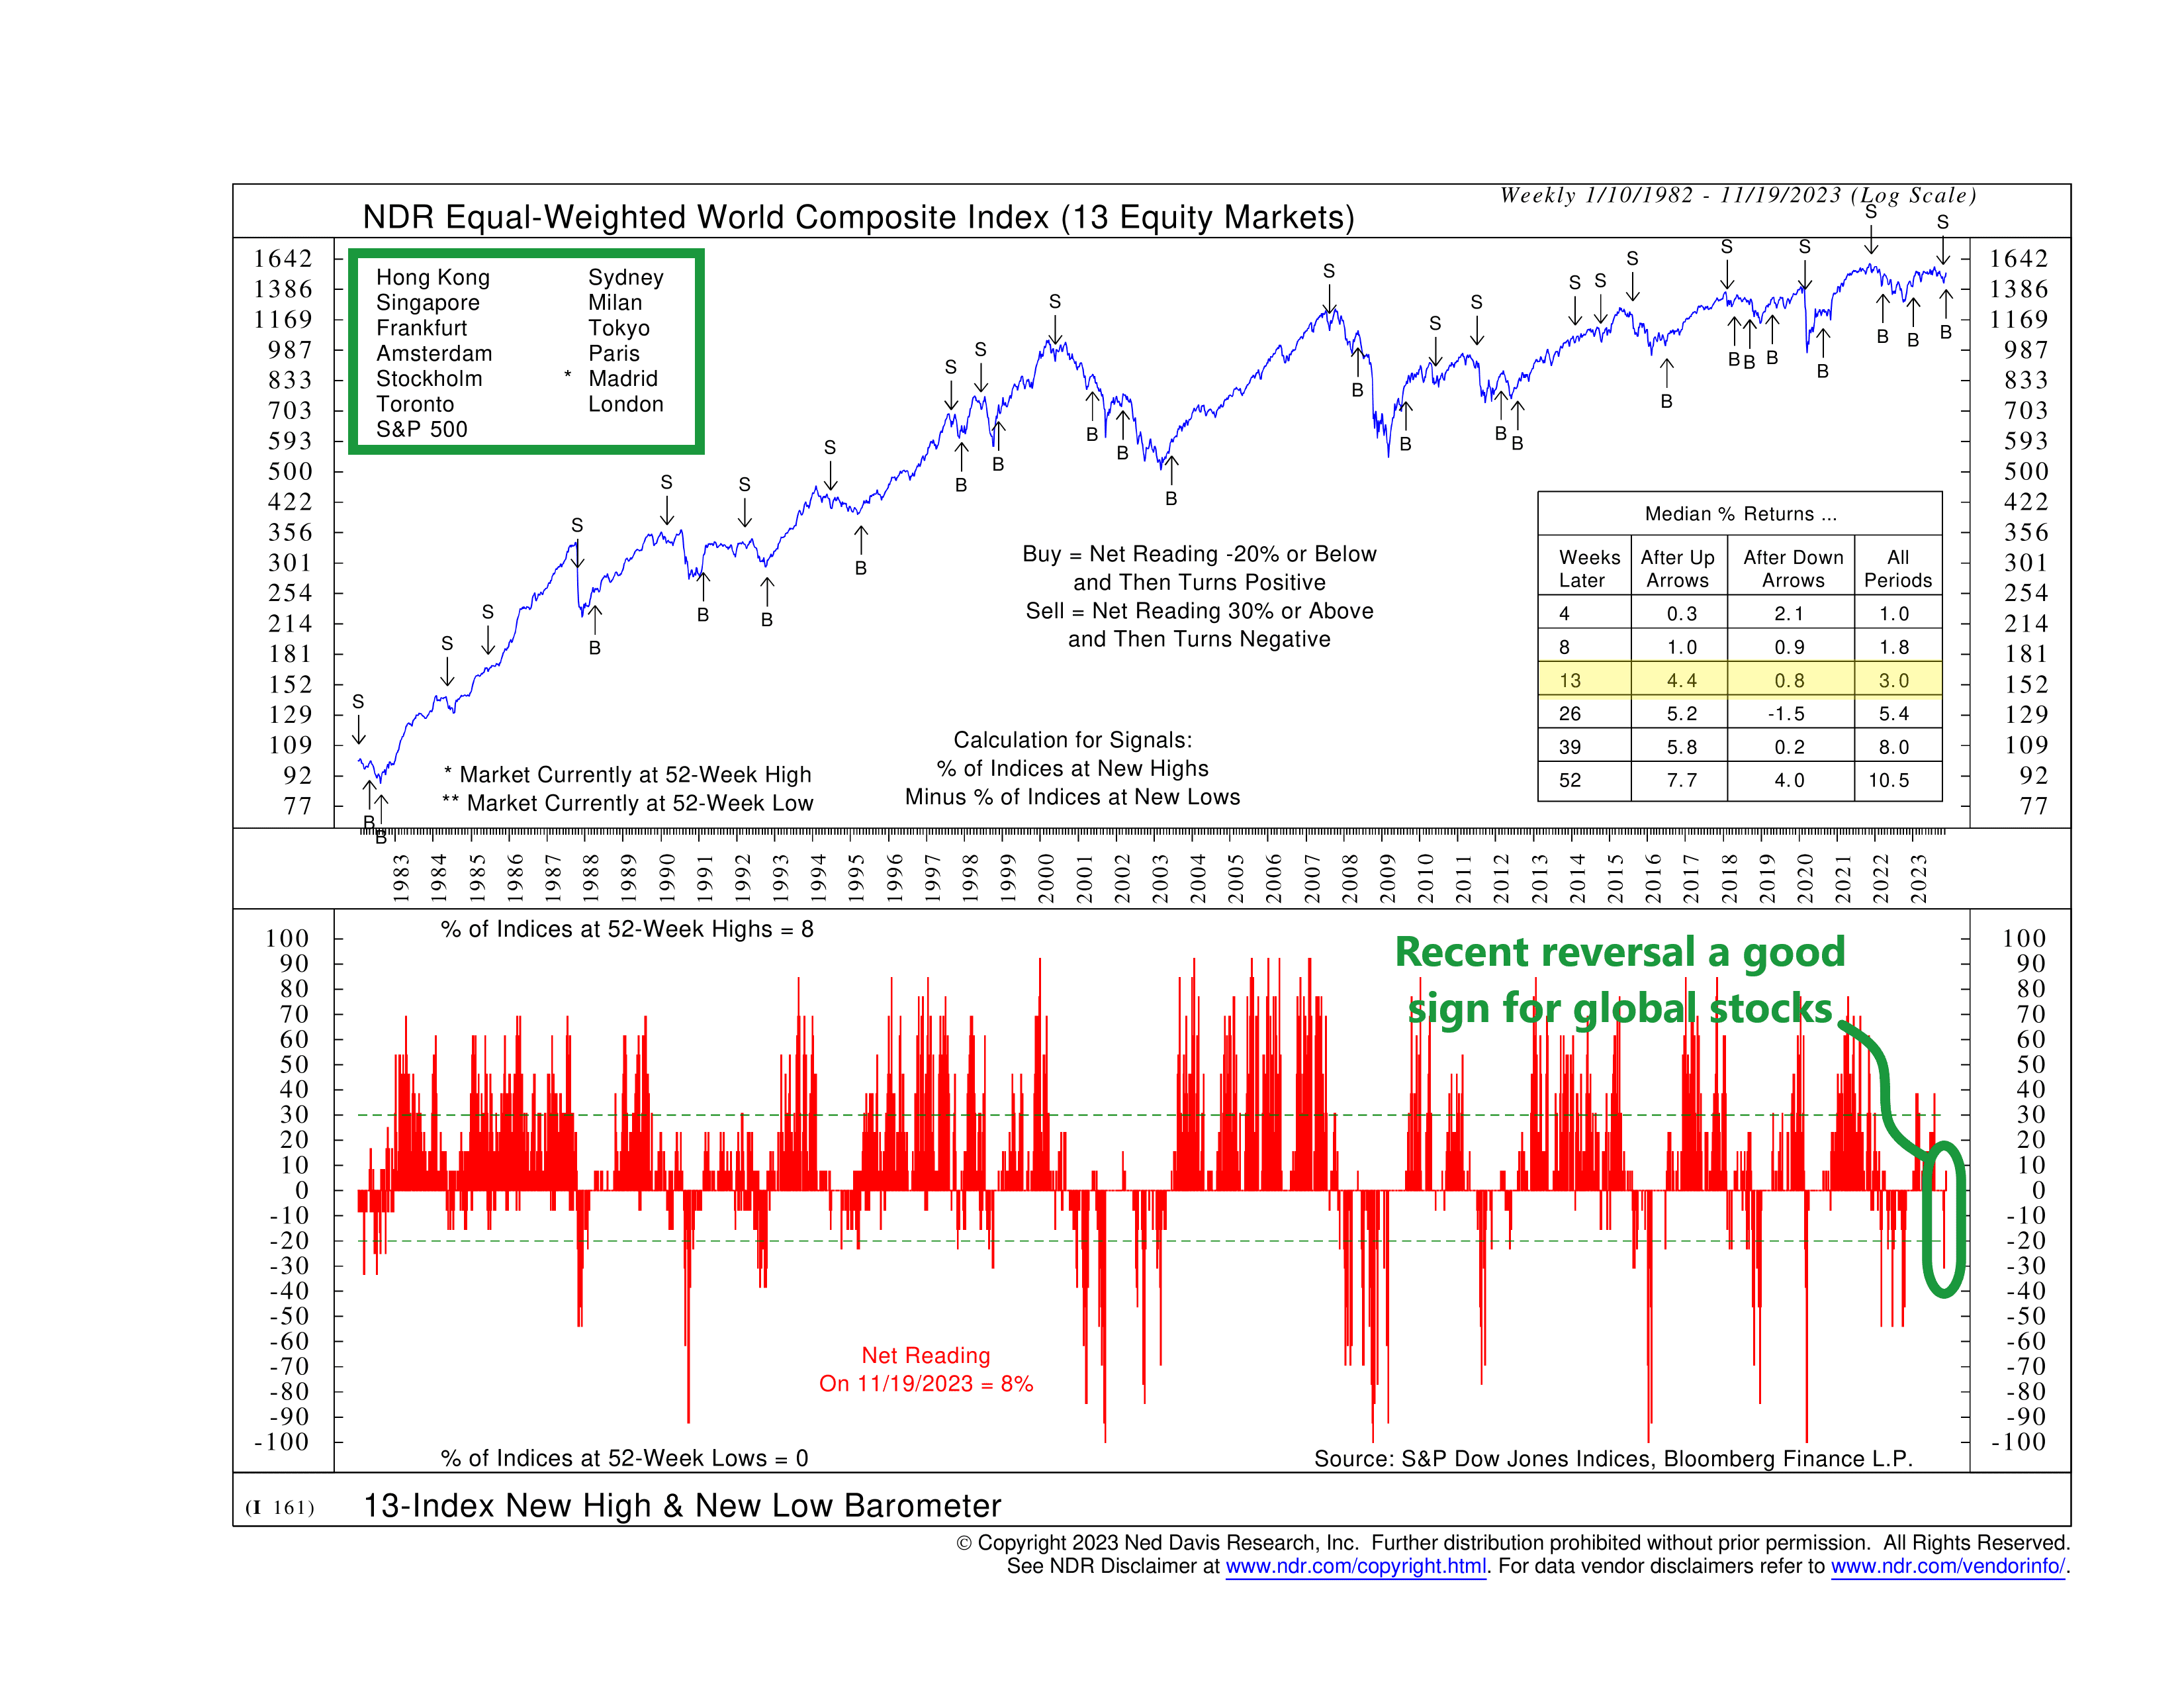
This week, we’re looking at something called the 13-Index New High & New Low Barometer. It gives us a combined view of 13 different stock market indexes from around the world, telling us how strong global stocks are. Basically, it’s a health check for the global market.
The 13 indexes involved are listed at the top-left corner of the chart. The indicator reading (bottom half of the chart) measures the percentage of these indexes trading at new 52-week highs or lows. If it’s 100%, it means all 13 are at new highs, and if it’s -100%, all are at new lows.
Now, when the net reading is less than -20% and then turns positive, it signals a buying opportunity for equity markets. And on the flip side, a net reading of 30% or more that turns negative gives a sell signal.
We like to focus on how the overall market does in the first 13 weeks after a buy or sell signal. What’s interesting is that after a buy signal, historically, there’s been an average 4.4% gain over the next 13 weeks. However, a sell signal sees only a 0.8% average gain over the same period. That’s a pretty wide return differential for a period of 13 weeks—or just one quarter of stock market trading.
The main thing you should take away from this indicator is that momentum is everywhere. Whether globally or locally, when stock markets make a move and change direction, prices tend to follow that new trend for some time. We saw this recently when the indicator reversed from its recent sell signal and triggered a buy signal, a sign that global stock market momentum has reversed to the upside. This kind of insight is valuable as it helps us manage risk and stay on the right side of the overall market trend.
This is intended for informational purposes only and should not be used as the primary basis for an investment decision. Consult an advisor for your personal situation.
Indices mentioned are unmanaged, do not incur fees, and cannot be invested into directly.
Past performance does not guarantee future results.
The S&P 500 Index, or Standard & Poor’s 500 Index, is a market-capitalization-weighted index of 500 leading publicly traded companies in the U.S.
