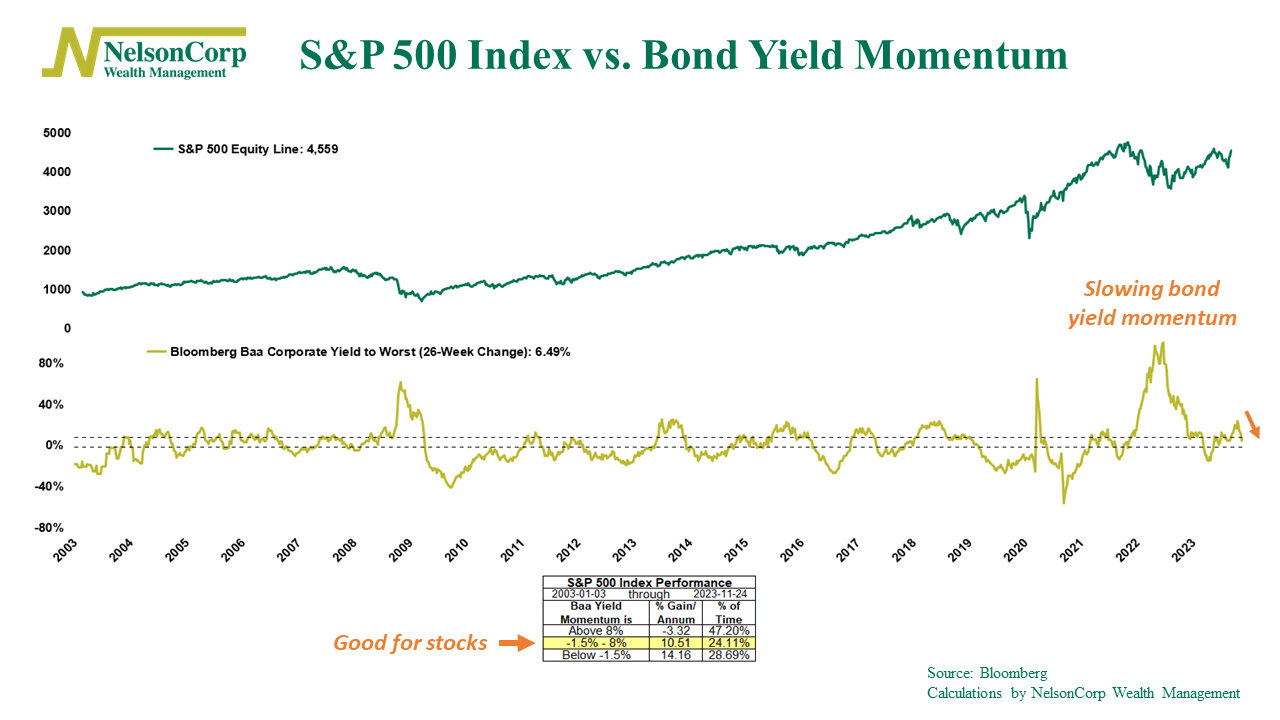
Stocks have done exceptionally well over the past month, and a major reason for this success is the recent decline in interest rates. In fact, as our featured indicator this week shows, stocks perform the best when a metric called “bond yield momentum” is falling.
Here’s how it works. The green line on the top of the graph is the S&P 500 Index (the stock market), and the gold line on the bottom illustrates bond yield momentum. Specifically, it measures the 26-week rate of change of the Bloomberg Baa Corporate Bond Yield Index (essentially, medium-quality corporate bond yields).
Historically, when this measure of bond yield momentum has jumped higher than 8%, stocks have struggled, returning just -3.3% per annum. But when bond yield momentum is below 8%, returns get much better, soaring to an impressive 10.5% per annum gain. Fall a little further, below -1.5%, and returns get really good, soaring to over 14% per annum.
Currently, we find ourselves in that middle zone—below 8% but above -1.5%. While not the most bullish zone, it’s still good compared to where we just were. In the fall, bond yield momentum spiked to around 20%, prompting a significant dip in the stock market. The fact that bond yield momentum is now rising at just a 6.5% clip over the past 26 weeks is a positive sign for stocks.
The bottom line? It looks like bond yield momentum is finally starting to chill out. There’s still space for it to slow down even more, but at these levels, stocks have the potential for strong returns.
This is intended for informational purposes only and should not be used as the primary basis for an investment decision. Consult an advisor for your personal situation.
Indices mentioned are unmanaged, do not incur fees, and cannot be invested into directly.
Past performance does not guarantee future results.
The S&P 500 Index, or Standard & Poor’s 500 Index, is a market-capitalization-weighted index of 500 leading publicly traded companies in the U.S.
