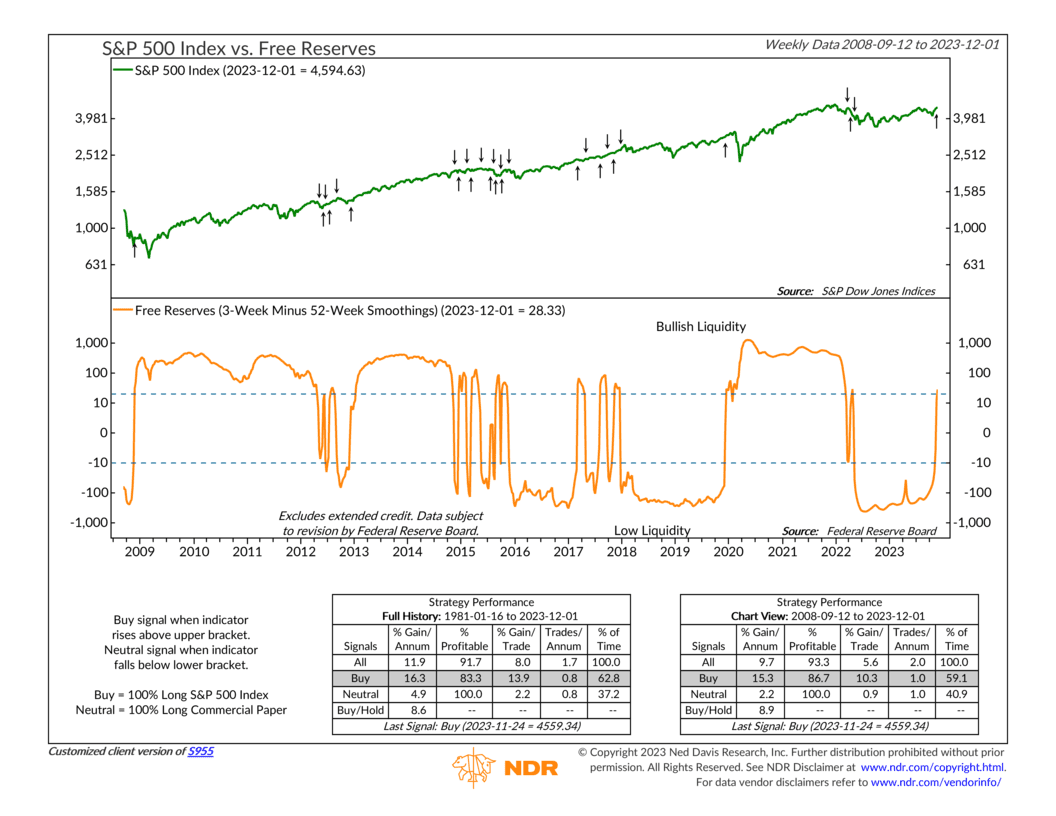
The stock market runs on cash. For this week’s featured indicator, we highlight a measure of excess cash in the banking system—called free reserves—and discuss why fluctuations in this measure can affect stock prices.
But first, what exactly are free reserves? In simple terms, it’s cash that a bank holds in excess of its required reserve ratio, a benchmark set by the Federal Reserve. The more free reserves a bank has, the greater its capacity to offer loans and make investments. Think of it as a measure of financial system liquidity – and more liquidity often translates to bullish vibes for stock prices.
Our indicator focuses on the trend in free reserves by subtracting the 52-week smoothing from the 3-week smoothing, represented by the orange line at the chart’s bottom clip. When this measure surpasses the upper bracket, it signals a buy for the S&P 500 stock index (shown by the green line in the top clip). Conversely, a dip below the lower bracket triggers a sell (or neutral) signal. Historically, buy signals have led to average annual S&P 500 gains of over 15%, while sell signals have been associated with more modest gains ranging from 2% to 5%.
Looking at the recent history of the indicator, we see that a sell signal was generated near the beginning of 2022, right when the Federal Reserve first started hiking interest rates. This makes sense because higher rates tend to zap liquidity or excess reserves out of the system as it encourages less borrowing.
Fast forward to last month, however, and our indicator flashed a buy signal as the trend in free reserves shot up. This surge in financial system liquidity likely played a role in the recent drop in longer-term rates – a bullish sign for stock prices.
The bottom line? There’s a golden rule in our industry – don’t “fight the Fed.” A great way to do that is by monitoring the trend in free reserves, as this indicator does. If the Fed is in an accommodative stance with high free reserves, it’s a positive signal for stocks. If not, exercising caution might be a prudent move.
This is intended for informational purposes only and should not be used as the primary basis for an investment decision. Consult an advisor for your personal situation.
Indices mentioned are unmanaged, do not incur fees, and cannot be invested into directly.
Past performance does not guarantee future results.
The S&P 500 Index, or Standard & Poor’s 500 Index, is a market-capitalization-weighted index of 500 leading publicly traded companies in the U.S.
