
What Did You Expect?
“Downward revision” is one of the most common phrases you’ll hear during earnings season. It’s a polite way of saying: “We got a little too optimistic.” This week’s indicator looks at how much those revisions are happening—and how much...Financial Focus – March 26th, 2025
This week’s Financial Focus highlights key Medicare enrollment steps for those nearing age 65, including timelines, automatic vs. manual enrollment, and the importance of applying early to avoid penalties or gaps in coverage. Nate and Mike emphasize tailoring decisions to each person’s specific situation and encourage listeners to seek guidance to better navigate the process.
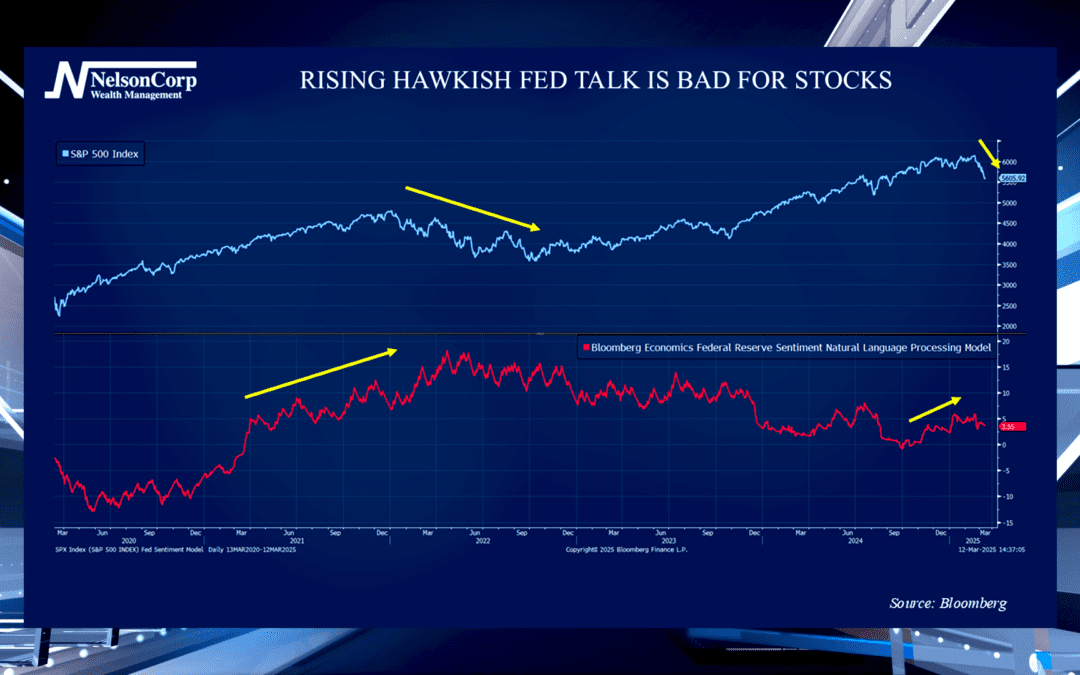
Hawkish Talk
Investors and the market have been looking for guidance from the Federal Reserve lately. David Nelson is here to explain how the Fed’s talk affects Wall Street and viewers’ investments.
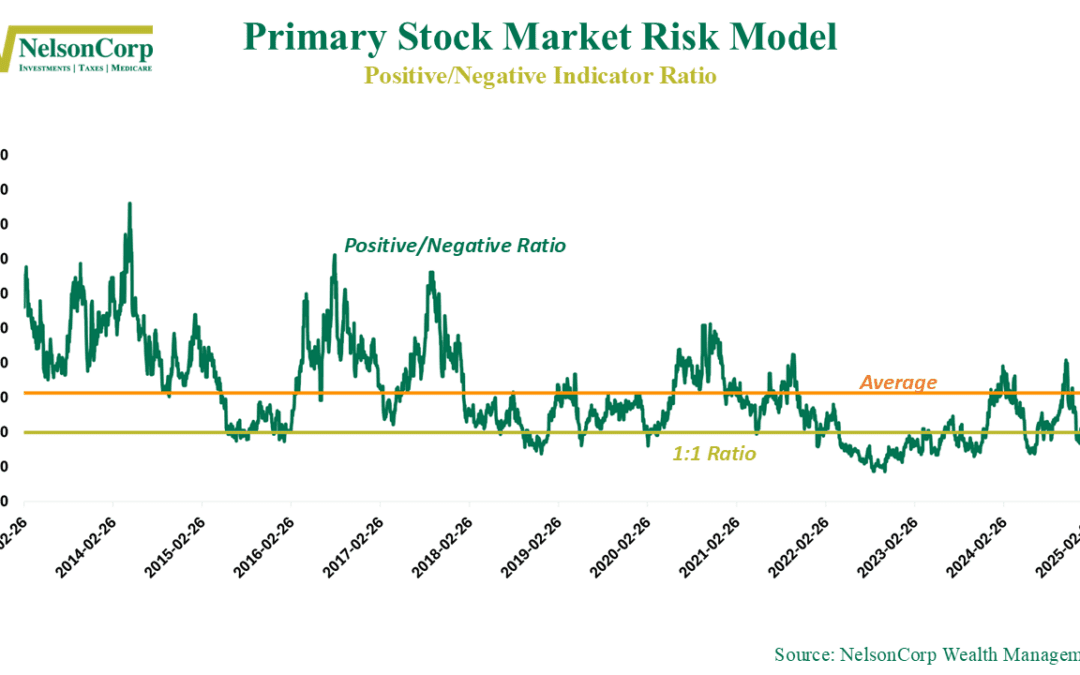
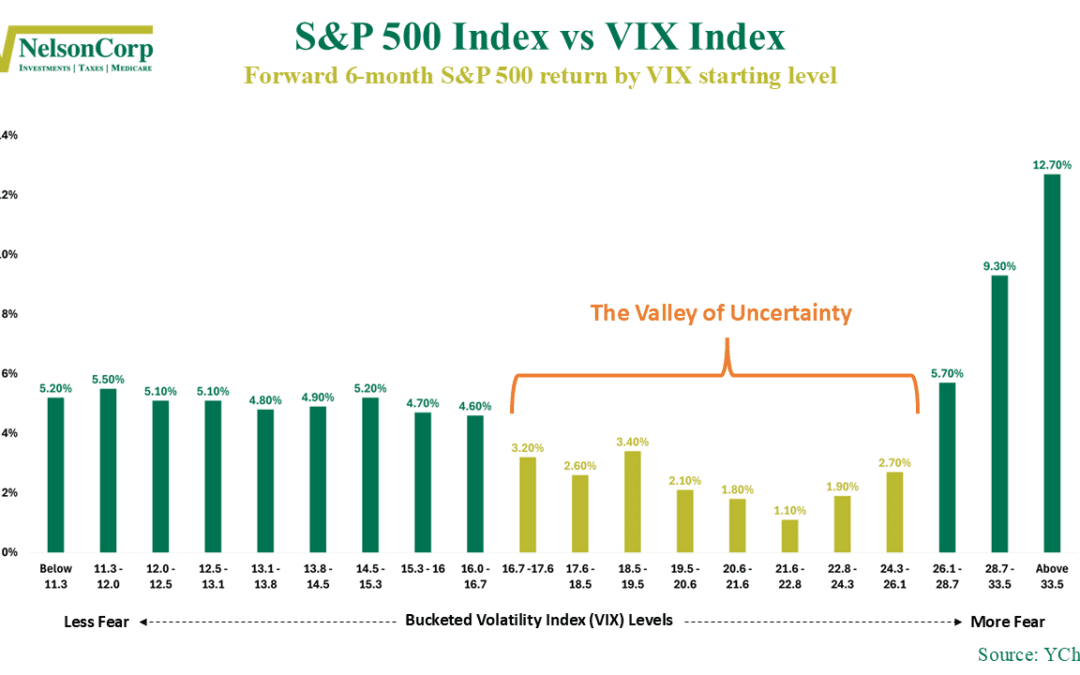
Guessing Game
Wall Street’s guessing game is in full swing—and we’re already near the bottom of the range. What does that mean for stocks from here? Check out this week’s commentary to see what our risk model and the VIX are saying now.